
Mastering the Relative Strength Index (RSI) for Precision Forex Trading
Welcome to this pivotal lesson in our complimentary Forex Trading Course Toronto at The Academy of Financial Markets. The Relative Strength Index (RSI), a cornerstone momentum oscillator, provides critical insights into price dynamics, enabling traders to identify high-probability entry and exit points. This comprehensive guide elucidates the RSI’s mechanics, strategic applications, and integration with other analytical tools, enriched with practical examples. Whether you aim to learn Toronto Forex or excel in our Stock Trading Course Toronto, mastering the RSI enhances your trading precision. Our Online Forex Mentorship provides tailored guidance to optimize your RSI strategies.
Table of Contents
- Fundamentals of the RSI
- RSI Divergence and Its Strategic Significance
- RSI in Trending vs. Ranging Markets
- Integrating RSI into a Trading Strategy
- Common Pitfalls in RSI Trading
- Impact of Timeframes on RSI Analysis
- Combining RSI with Other Technical Indicators
- Conclusion
- Frequently Asked Questions
Fundamentals of the RSI
The Relative Strength Index (RSI), developed by J. Welles Wilder in 1978, is a momentum oscillator that quantifies the speed and magnitude of price movements, oscillating between 0 and 100. Calculated as RSI = 100 – (100 / (1 + RS)), where RS is the ratio of average gains to average losses over a specified period (typically 14), the RSI identifies overbought (above 70) and oversold (below 30) conditions. A 50-line crossover signals trend shifts, with values above 50 indicating bullish momentum and below 50 suggesting bearish momentum. Its historical reliability makes it a staple for forecasting price action.
Example: On a daily EUR/USD chart, the RSI (14-period) rises from 45 to 55, crossing the 50-line, signaling bullish momentum. A trader buys 0.5 lots at 1.1050, targeting a 60-pip gain, yielding $405 CAD if successful. Our Forex Trading Academy Toronto emphasizes RSI’s role in precision trading.
RSI Divergence and Its Strategic Significance
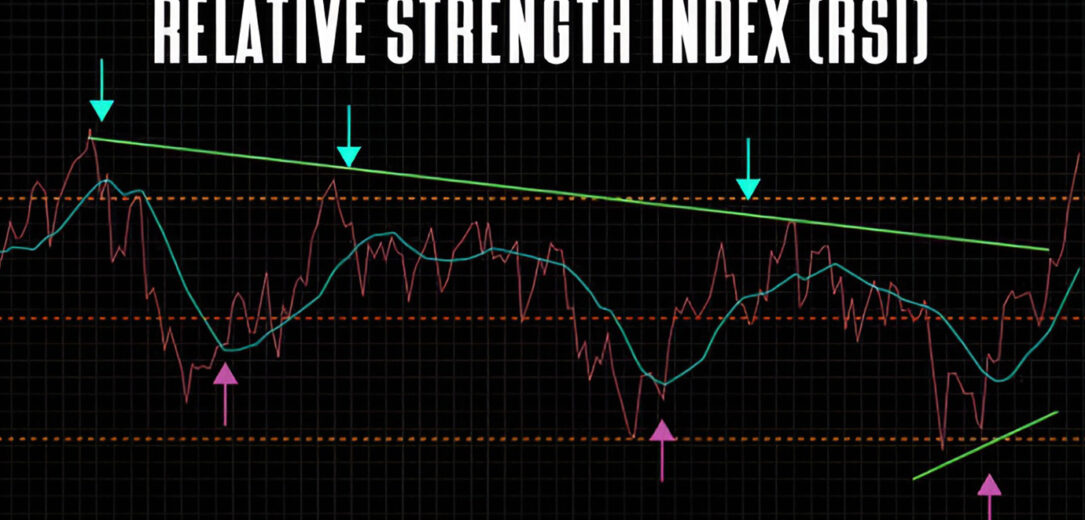
RSI divergence occurs when price and RSI movements diverge, signaling potential trend reversals. Bullish divergence (price makes lower lows, RSI higher lows) indicates waning selling pressure, while bearish divergence (price makes higher highs, RSI lower highs) suggests weakening buying momentum. False divergences require confirmation from other indicators.
Example: GBP/USD forms a higher high at 1.3100, but RSI forms a lower high at 75, indicating bearish divergence. A trader shorts 0.4 lots at 1.3090, with a 30-pip stop-loss at 1.3120 and a 90-pip take-profit at 1.3000, risking $162 CAD for a $486 gain. Combining divergence with MACD confirmation enhances reliability, as taught in our Learn Forex Toronto.
RSI in Trending vs. Ranging Markets
RSI’s efficacy varies by market condition, requiring tailored approaches:
- Trending Markets: In strong trends, RSI may remain elevated (bullish) or depressed (bearish) for extended periods. Adjust thresholds: 40-50 for oversold in uptrends, 50-60 for overbought in downtrends. Example: In a USD/JPY uptrend, RSI at 45 signals a buy at 145.50, with a 50-pip stop-loss and 150-pip take-profit, yielding $810 CAD on 0.4 lots.
- Ranging Markets: Traditional 30 (oversold) and 70 (overbought) levels apply. Divergences near support/resistance signal reversals. Example: EUR/USD ranges between 1.1000-1.1100; RSI at 28 near 1.1000 prompts a buy, yielding $405 CAD on a 60-pip move.
Confirmation via ADX or volume analysis refines signals, as emphasized in our Financial Markets Education Toronto.
Trade with Confidence at OxSecurities
Ready to leverage RSI for precision trading? Open an account with OxSecurities, a trusted broker offering competitive spreads, advanced trading tools, and exceptional support. Start your trading journey today!
Open Trading AccountIntegrating RSI into a Trading Strategy
Incorporating RSI into a multi-indicator strategy enhances signal reliability. Set stop-losses and take-profits using ATR or recent price levels, backtest strategies on historical data, and maintain discipline to avoid emotional trading.
Example: A trader combines RSI with MACD on USD/CAD. RSI at 35 and a bullish MACD crossover at 1.3500 signal a buy of 0.3 lots, with a 30-pip stop-loss at 1.3470 (ATR-based) and a 90-pip take-profit at 1.3590, risking $121.50 CAD for a $364.50 gain. Regular reviews, as taught in our Forex Mentor, ensure strategy alignment.
Common Pitfalls in RSI Trading
- Overreliance on RSI: Using RSI alone ignores market context. Example: Buying EUR/USD at RSI 25 without volume confirmation leads to a $200 loss.
- Ignoring Fundamentals: News events can override RSI signals. Example: An oversold RSI on USD/CAD fails post a Bank of Canada rate hike.
- Misreading Market Sentiment: RSI signals in a bearish trend may fail. Example: Buying GBP/USD at RSI 30 in a downtrend misses a 50-pip drop.
- Neglecting Divergences: Missing RSI divergences overlooks reversals. Example: Ignoring bearish divergence on AUD/USD costs a $300 opportunity.
- Static Settings: Default 14-period RSI may not suit volatile pairs like GBP/JPY.
Our Toronto Forex guides traders to avoid these errors.
Impact of Timeframes on RSI Analysis
RSI sensitivity varies by timeframe: shorter timeframes (e.g., 5-minute) produce more signals but increase noise, while longer timeframes (e.g., daily) offer stability. Consistency across multiple timeframes strengthens signals, and conflicting signals require prioritization based on trading horizon.
Example: On a 4-hour USD/JPY chart, RSI at 72 signals overbought, but a daily RSI at 60 confirms an uptrend. A trader buys on a pullback, aligning with the daily trend, yielding $540 CAD. Our Forex Trading Course Toronto teaches timeframe alignment.
Combining RSI with Other Technical Indicators
- Moving Averages: RSI at 35 near a 50-day SMA signals a buy. Example: EUR/USD at 1.1000 with RSI 32 and 50-day SMA support yields a $405 gain.
- Bollinger Bands: RSI at 75 touching the upper band signals a sell. Example: Shorting GBP/JPY at 190.00 with RSI 78 yields $648 CAD.
- MACD: RSI and MACD bullish crossovers confirm entries. Example: USD/CAD buy at 1.3500 with RSI 40 and MACD crossover yields $364.50 CAD.
- Fibonacci Levels: RSI at 30 near a 61.8% retracement signals a buy. Example: AUD/USD at 0.6500 with RSI 28 yields $405 CAD.
- Volume: Rising tick volume with RSI signals strengthens trades. Example: USD/CHF buy at 0.8700 with RSI 35 and volume spike yields $486 CAD.
Conclusion
The Relative Strength Index is a powerful tool for navigating the forex market’s complexities, offering precise signals for overbought, oversold, and trend conditions. By mastering its applications, integrating it with complementary indicators, and avoiding common pitfalls, traders can enhance their risk-adjusted returns. Our Forex Trading Course Toronto empowers you to leverage RSI for sustained success.
Frequently Asked Questions
- Can RSI be used as a standalone indicator?
While potent, RSI is best used with other tools like MACD or volume to confirm signals, reducing false positives. Relying solely on RSI risks misinterpretation, as taught in our Forex Trading Academy Toronto. - How often should RSI settings be adjusted?
Adjust RSI periods (e.g., 5 for scalping, 21 for swing trading) based on pair volatility and timeframe. Backtest settings to optimize signal accuracy for specific market conditions. - Is RSI effective for both day and long-term trading?
Yes, RSI suits day trading (short timeframes) for quick signals and long-term trading (daily/weekly charts) for trend entries, with adjustments for sensitivity. - How does RSI perform during news events?
Volatility from news can skew RSI readings, causing prolonged overbought/oversold signals. Combine with economic calendars to avoid misinterpretation. - What are common RSI trading mistakes?
Overreliance, ignoring fundamentals, misreading market trends, neglecting divergences, and using static settings can lead to losses. Multi-indicator confirmation mitigates these risks, as taught in our Learn Forex Toronto.
Disclaimer
The information in this lesson is provided for educational purposes only and does not constitute financial or investment advice. Forex trading involves significant risks, including the potential loss of all invested capital due to market volatility and leverage. Past performance is not indicative of future results. Always conduct thorough research and consult a qualified financial advisor before trading. The Academy of Financial Markets is not responsible for any financial losses incurred from applying the strategies discussed in this lesson.