
Candlestick Charts Explained: How to Read Buying Pressure, Selling Pressure, Rejection & Momentum
Learn how candlesticks communicate price movement, buying and selling pressure, momentum, rejection and market indecision — without memorizing dozens of meaningless patterns.
Every candlestick tells a story.
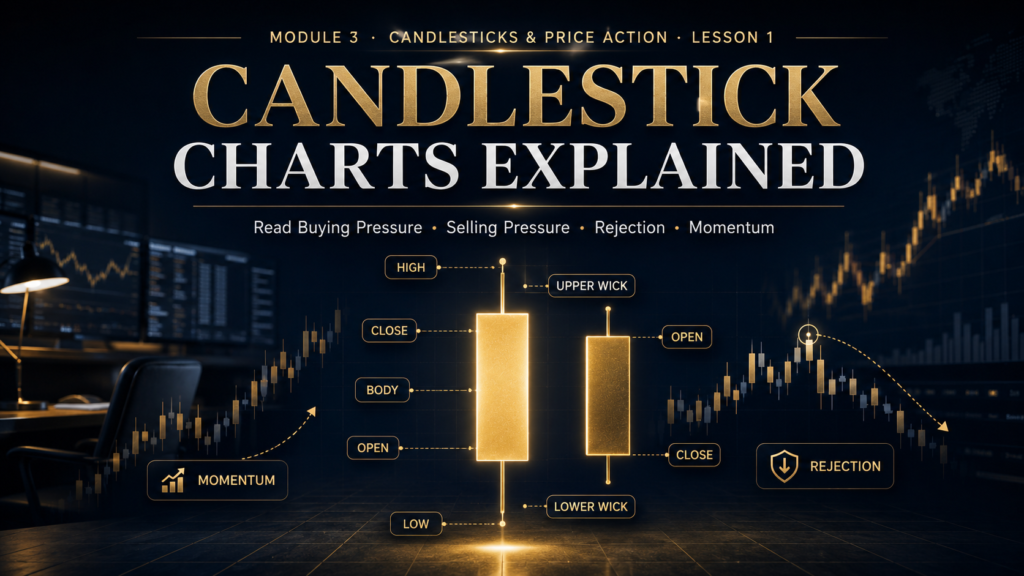
It tells you where price opened, where it closed, how far buyers pushed upward, how far sellers pushed downward and which side had greater control by the end of that period.
But the goal is not to memorize fifty candlestick names and blindly trade every pattern you see.
Once you understand the logic behind the candle, patterns become much easier to interpret because you are reading pressure, rejection and momentum instead of memorizing shapes.
What You’ll Learn
What Is a Candlestick?
A candlestick represents the movement of price during a specific period of time.
On a five-minute chart, one candle represents five minutes of price movement.
On a one-hour chart, one candle represents one hour.
On a daily chart, one candle represents an entire trading day.
The Four Prices Inside Every Candle
Every completed candlestick contains four essential prices.
The price at the beginning of the candle period.
The highest level reached while the candle was forming.
The lowest level reached during the period.
The final price when the candle period ends.
What Is a Bullish Candlestick?
A bullish candle forms when price closes above where it opened.
Buyers were able to move price upward from the opening level by the time the candle completed.
The larger and stronger the bullish body, the greater the buying pressure may have been during that period.
What Is a Bearish Candlestick?
A bearish candle forms when price closes below where it opened.
Sellers were able to push price below the opening level before the period ended.
What Does the Candle Body Tell You?
The body represents the distance between the candle’s open and close.
Body size can tell you a lot about momentum.
Strong Directional Pressure
Price traveled a meaningful distance between open and close.
Limited Progress
Buyers and sellers may have been more balanced during the period.
What Do Candlestick Wicks Tell You?
Wicks — sometimes called shadows — show how far price traveled beyond the candle body.
They show areas that price visited but could not fully hold into the close.
Understanding Upper-Wick Rejection
A long upper wick tells you that buyers were initially able to push price higher.
But sellers then entered strongly enough to push price back down before the candle closed.
The significance of that rejection depends heavily on where it occurs.
Understanding Lower-Wick Rejection
A long lower wick shows that sellers were able to move price significantly lower.
Buyers then stepped in and recovered part or all of the decline.
Candle Location Changes Everything
A rejection candle in the middle of nowhere may mean very little.
The same candle at major support after a sell-side liquidity sweep can become much more meaningful.
Bullish rejection candle randomly appears in the middle of a sideways range.
Bullish rejection candle forms after sweeping a previous low at higher-timeframe support.
Reading Momentum Through Candles
Momentum refers to the strength and speed of price movement.
Candlesticks can reveal when momentum is increasing or decreasing.
Possible Signs of Increasing Momentum
What Strong Bullish Momentum Looks Like
This suggests buyers are not only pushing price higher — they are also holding much of the progress into each candle close.
What Strong Bearish Momentum Looks Like
How Candles Show Momentum Is Weakening
Trends can lose strength before they reverse.
Candles may begin showing that change.
Possible Warning Signs
Where a Candle Closes Matters
The close is one of the most important parts of a candle.
Buyers retained most of the candle’s upward progress.
Sellers retained most of the candle’s downward progress.
Anatomy of a Strong Bullish Candle
Anatomy of a Strong Bearish Candle
What Does an Indecision Candle Tell You?
Some candles have small bodies with meaningful wicks on both sides.
This suggests neither buyers nor sellers maintained clear control.
Indecision is not automatically bullish or bearish. Its meaning depends on what happened before it and where it formed.
The Same Candle Can Mean Different Things
Imagine a candle with a long lower wick.
Could show strong rejection of lower prices and renewed buying interest.
May have little actionable significance.
Stop Memorizing Candlestick Patterns Without Context
Candlestick education often becomes a giant list:
Those names can be useful shorthand.
But knowing the name of the candle does not tell you whether the trade is good.
Combine Candles With Market Structure
Candlestick analysis becomes far more useful when combined with everything you learned in Module 2.
Now the candle has context.
Example: Bearish Rejection at Resistance
Read Candle Sequences, Not Only Single Candles
Markets communicate through sequences.
Several candles together can reveal more than one isolated candle.
Wait for the Candle to Close
An unfinished candle can change dramatically.
A candle that looks like a powerful breakout halfway through the period may finish as a rejection wick.
A candle that appears extremely bearish can recover before the close.
Candles Mean More on Higher Timeframes
A five-minute candle contains five minutes of trading activity.
A four-hour candle contains four hours.
A daily candle contains an entire day.
A Huge Candle Is Not Automatically a Good Entry
Strong momentum often attracts traders after the move has already happened.
They see a massive bullish candle and buy near the top.
The market then pulls back normally and their entry immediately looks terrible.
“That candle is huge — I have to get in now.”
“Momentum is strong. Where would a logical pullback or continuation entry exist?”
Practical Example: Reading a Bullish Candle Properly
Imagine EUR/USD is trading at support.
What happened?
If this occurs at meaningful support after a liquidity sweep, the information becomes far more valuable than if it occurred randomly.
Practical Example: Reading Bearish Rejection
Common Candlestick Reading Mistakes
A candle name does not automatically create an edge.
Candles at major support or resistance carry different information from random candles in the middle of a range.
An unfinished candle can completely change before the period ends.
Rejection only matters when the surrounding market context supports it.
Strong candles can leave poor entries and poor risk-to-reward after the move is already extended.
A series of candles often communicates more than a single candle.
The Candlestick Reading Framework
Understand What Buyers and Sellers Are Actually Doing
Financial Markets Academy offers live 1-on-1 mentorship for traders who want to learn how candlesticks, market structure, support and resistance, liquidity and trade timing work together in real market conditions.
Reserve Your Seat →Candlestick Analysis Checklist
Frequently Asked Questions
What does a candlestick show?
A candlestick shows the open, high, low and close of a market during a specific period of time.
What does a long wick mean?
A long wick shows that price moved significantly in one direction but could not hold that level into the close. Its meaning depends on where it forms.
What does a large bullish candle mean?
It can indicate strong buying pressure during that candle period, especially when the candle closes near its high.
Should I trade every rejection candle?
No. Rejection candles are far more useful when they align with meaningful structure, support or resistance, liquidity and confirmation.
Why should I wait for the candle to close?
An unfinished candle can change significantly before its timeframe ends, so waiting for the close provides completed information.
Are candlestick patterns enough to trade profitably?
Candlestick patterns alone do not provide full market context. Structure, location, liquidity, risk and trade management should also be considered.
Module 3 · Lesson 1 Knowledge Quiz
B. Open, high, low and close
C. Bid, ask, spread and volume
D. Entry, exit, profit and loss
B. Price must continue higher
C. Sellers were always stronger
D. The market cannot reverse
B. Guaranteed bullish reversal
C. No market activity
D. Maximum leverage
B. Candles only matter on support
C. Location never matters
D. It changes the broker spread
B. No, context matters
C. Only on gold
D. Only on daily charts
Key Takeaways
Lesson 2: Rejection Candles & Pin Bars
Now that you understand the anatomy of a candle, the next lesson focuses specifically on rejection — including pin bars, long-wick candles, failed price moves and how to determine whether rejection is meaningful or just market noise.