Doji, Inside Bars & Indecision: How to Read Compression, Balance & Breakout Pressure
14 min lessonAug 15, 2026
Module 3 · Candlesticks & Price Action · Lesson 4
Doji, Inside Bars & Indecision: How to Read Compression, Balance & Breakout Pressure
Learn what doji candles, inside bars and tightening price action reveal about buyer-seller balance, weakening momentum, volatility compression and the pressure that can build before expansion.
Strong bullish and bearish candles are often followed by periods where price slows down, ranges tightly or becomes temporarily balanced.
Those quieter periods are not necessarily useless.
In many cases, they are telling you something important:
Momentum has paused. Buyers and sellers are temporarily closer to balance. Pressure may be building for the next directional move.
The goal of this lesson is not to predict every breakout from an inside bar or reverse every time you see a doji. It is to understand what indecision and compression mean within the larger market context.
Lesson Objectives
What You’ll Learn
✓ What a doji candle represents
✓ What an inside bar means
✓ How volatility compression develops
✓ Why indecision is location-dependent
✓ How false breakouts occur
✓ How to wait for expansion and confirmation
What Is Market Indecision?
Indecision describes a period where neither buyers nor sellers are maintaining clear directional control.
Price may move higher and lower during the candle, yet finish near where it started.
Alternatively, several candles may remain trapped inside a narrow price range as both sides wait for new information or sufficient order flow.
Key Principle
Indecision does not tell you which direction the market must move next. It tells you that the previous directional pressure is no longer completely dominant.
What Is a Doji Candle?
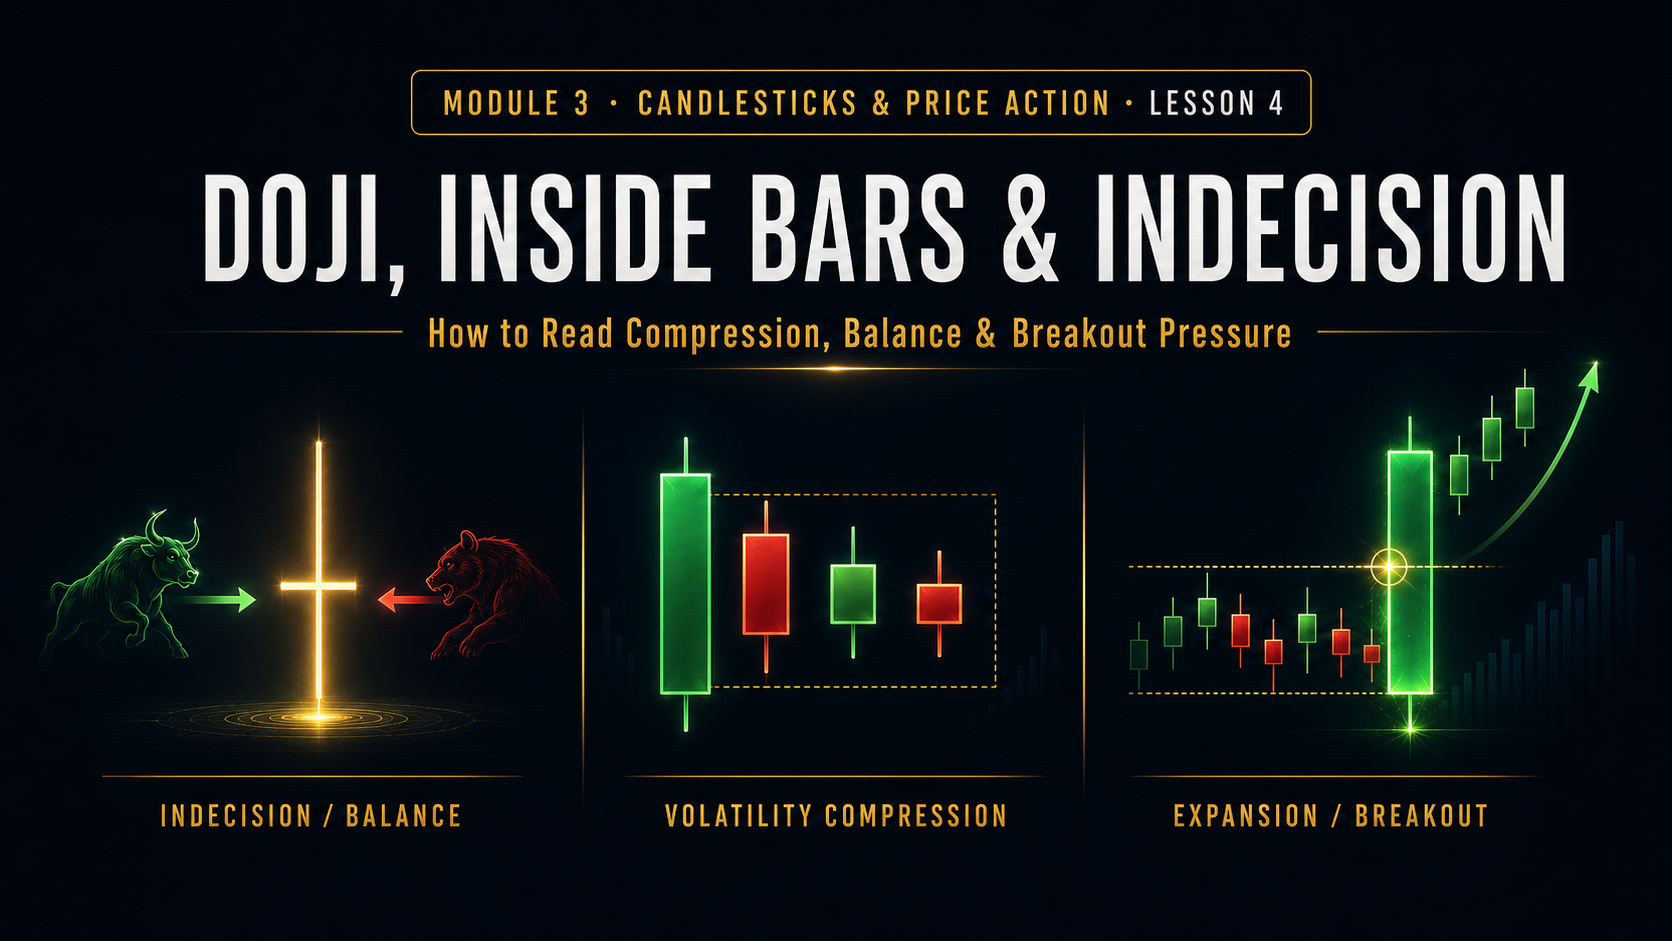
A doji is a candlestick where the opening and closing prices are very close together.
The candle may still have substantial upper and lower wicks, meaning price moved during the period but ultimately finished near its starting point.
Doji Story
Price Moves → Buyers Push → Sellers Push → Neither Side Wins Decisively → Close Near Open
What Does a Doji Actually Mean?
A doji represents temporary balance or hesitation.
That does not automatically mean reversal.
One of the biggest beginner mistakes is seeing a doji and immediately assuming the trend is about to reverse.
Sometimes a doji marks exhaustion. Sometimes it is only a brief pause before the existing trend continues.
A Doji at Resistance Is Different From a Doji in the Middle of Nowhere
At Major Resistance
A doji after strong buying may indicate momentum is stalling where sellers have a reason to respond.
Middle of a Range
A doji may simply reflect the same indecision that already exists throughout the range.
Pattern + Location + Structure = Meaning
The candle alone is never the entire analysis.
Different Doji Shapes Tell Slightly Different Stories
You do not need to memorize every textbook name, but understanding the wick placement can help you interpret what happened.
Neutral Doji
Wicks on Both Sides
Both buyers and sellers moved price, but neither side retained control.
Long Lower Wick
Lower Price Rejection
Sellers pushed down significantly, but buyers recovered the move.
Long Upper Wick
Higher Price Rejection
Buyers pushed upward significantly, but sellers forced price back.
Doji After Strong Momentum
A doji can become more interesting after a series of strong directional candles.
Candle 1: Large bullish body.
Candle 2: Large bullish body.
Candle 3: Smaller bullish body.
Candle 4: Doji at resistance.
Story: buying momentum may be slowing.
That is still not enough to assume a reversal. The next candles must confirm whether sellers are actually taking control.
What Is an Inside Bar?
An inside bar is a candle whose high and low remain within the range of the previous candle.
The previous candle is commonly called the mother bar.
Basic Inside Bar Structure
Mother Bar: Larger outer range.
Inside Bar: Entire candle range remains within mother bar.
Meaning: Short-term volatility has contracted.
What Does an Inside Bar Tell You?
An inside bar tells you that the latest candle had less range than the candle before it.
Price has temporarily compressed.
Inside bars represent contraction — not automatic direction.
What Is Volatility Compression?
Volatility compression occurs when price movement becomes progressively tighter.
Candles become smaller. Highs and lows move closer together. Price may remain trapped inside an increasingly narrow range.
Compression Sequence
Expansion → Smaller Candles → Inside Bar → Tight Range → Breakout
Markets often rotate between periods of expansion and contraction.
Expansion and Contraction
Expansion
Price Moves Aggressively
Larger bodies, stronger momentum, wider ranges and clearer directional movement.
Contraction
Price Compresses
Smaller ranges, overlapping candles, inside bars and reduced directional progress.
Compression Can Build Breakout Pressure
Imagine price repeatedly presses against resistance.
Each pullback becomes smaller.
Sellers are still defending the level, but buyers are not retreating very far.
Bullish Compression
Resistance stays flat while lows continue rising toward it.
That can indicate buyers are maintaining increasingly higher prices beneath resistance.
Bearish Compression Into Support
The opposite can happen when price repeatedly presses against support.
Bearish Compression
Support remains flat while highs continue falling toward it.
Sellers are maintaining progressively lower prices as the market approaches support.
Compression increases attention — not certainty.
Price can break either side, sweep one boundary before reversing, or remain trapped longer than expected.
Inside Bars as Trend Continuation
Inside bars can appear during strong trends as a temporary pause.
1. Market is strongly bullish.
2. Large bullish displacement candle forms.
3. Small inside bar develops.
4. Price remains above broken resistance.
The inside bar may represent a pause before continuation.
Inside Bars Can Also Appear Near Reversals
An inside bar does not belong exclusively to continuation setups.
For example, price may rally into major resistance, sweep a previous high, reject strongly and then compress inside the rejection candle.
The doji showed hesitation. The bearish engulfing candle showed sellers beginning to act on that hesitation.
Inside Bar Followed by Displacement
Another strong sequence occurs when compressed price is followed by a large expansion candle.
1. Price consolidates at support.
2. Inside bar forms.
3. Range becomes tighter.
4. Bullish displacement candle breaks the mother-bar high.
Compression transitions into expansion.
Structure Determines Which Breakout Matters
Suppose an inside bar forms inside a larger bullish trend.
The market has just pulled back to support and the higher-timeframe structure remains intact.
A bullish breakout may align with the larger structure.
A bearish break, however, may simply extend the pullback unless it also breaks meaningful structure.
Not every breakout has equal structural importance.
Compression Around Liquidity
Price often compresses near obvious highs and lows.
That can make the eventual reaction particularly important.
1. Equal highs form.
2. Price compresses beneath them.
3. Buy-side liquidity builds above highs.
4. Price trades above the highs.
5. Candle closes strongly above.
6. Breakout receives follow-through.
Compare that with a wick above the highs followed by a close back inside the compression range — a potential liquidity sweep instead of a genuine breakout.
What Confirms a Compression Breakout?
Useful Breakout Evidence
✓ Strong candle close outside range
Free Academy Access
Unlock the rest of this lesson free
Sign in to continue, or create a 100% free Academy account and unlock the full member experience.
When you are ready, take the 30-question Financial Markets Assessment. Score 70% or higher to instantly earn your verified Certificate of Completion. You can retake it free as many times as needed.

 11 min
 12 min
 12 min