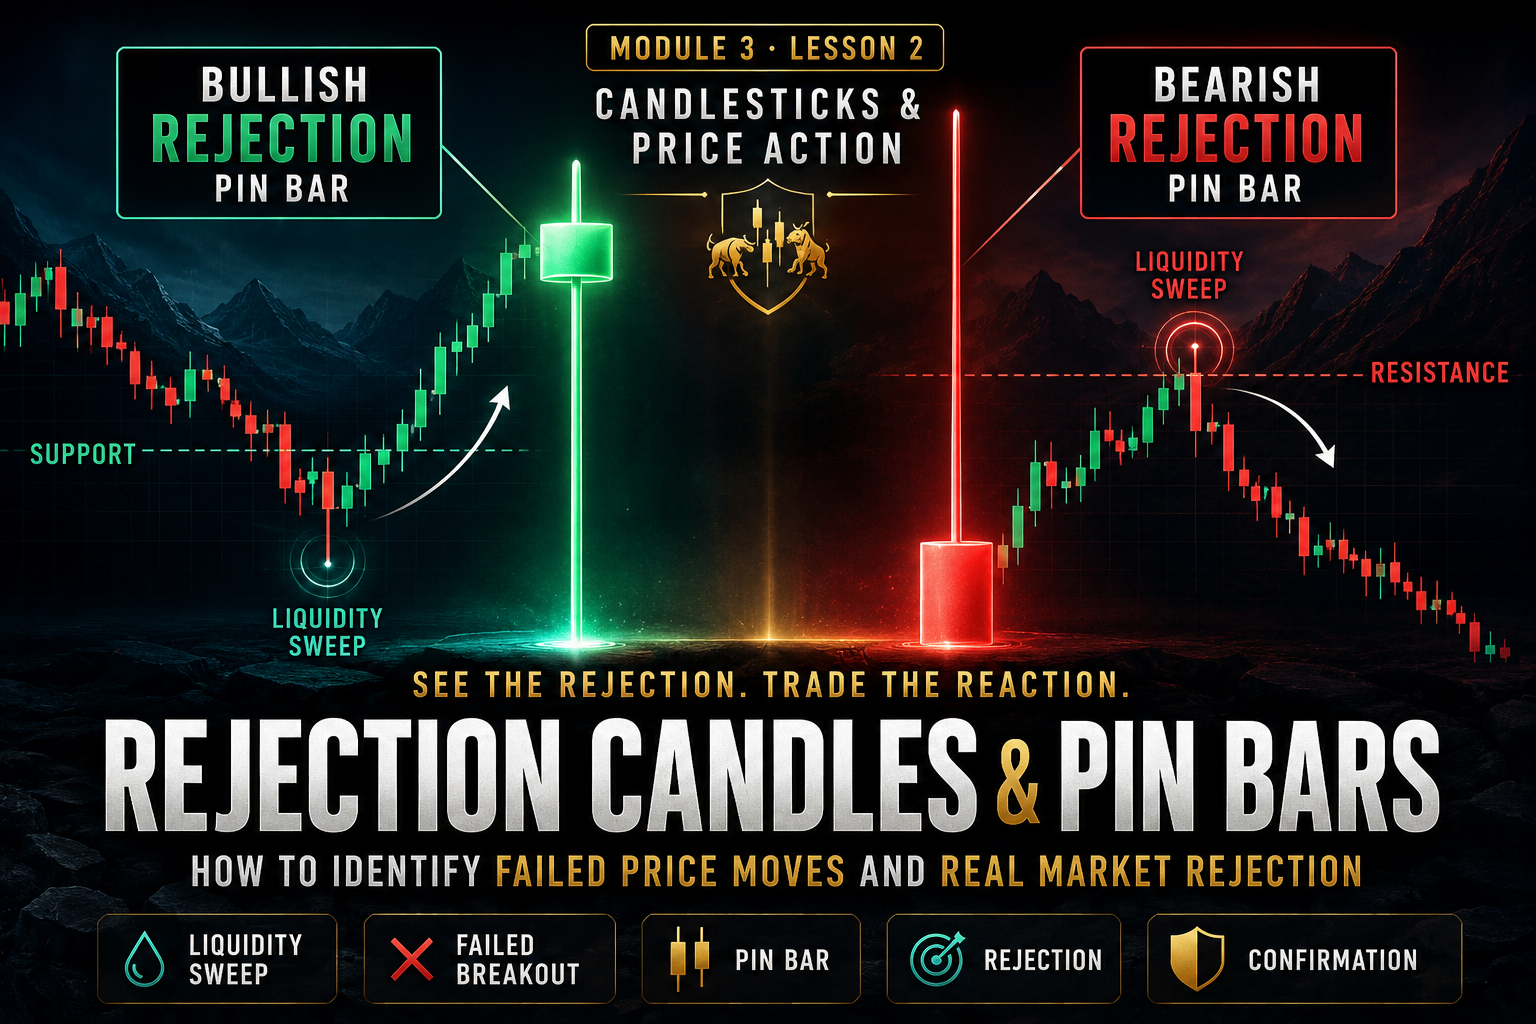
Module 3 · Candlesticks & Price Action · Lesson 2
Rejection Candles & Pin Bars: How to Identify Failed Price Moves and Real Market Rejection
Learn how long-wick candles, pin bars and failed price moves reveal rejection — and how to separate meaningful price-action confirmation from random market noise.
Rejection Candles
Pin Bars
Price Action
Confirmation
Price can move aggressively toward a level and then suddenly fail.
Buyers may push through resistance only to lose control before the candle closes. Sellers may break below support only to see price immediately reclaimed by buyers.
Those failed moves often leave evidence behind in the shape of a long candlestick wick.
A rejection candle tells you price reached an area — but the market was unable or unwilling to remain there.
The important question is not simply whether a candle has a long wick. The real question is where the rejection happened, what price rejected, and what the market did next.
Lesson Objectives
What You’ll Learn
✓ What a rejection candle means
✓ How bullish rejection works
✓ How bearish rejection works
✓ What makes a quality pin bar
✓ Why location matters
✓ How to confirm rejection before trading
What Is Price Rejection?
Price rejection occurs when the market trades into an area but fails to maintain that price.
Price may temporarily move through support, resistance, a previous high, a previous low or another significant zone before being pushed back.
That failed movement often creates a wick.
Rejection in One Sentence
Price explored an area, but opposing market pressure prevented it from holding there.
What Is Bullish Rejection?
Bullish rejection occurs when price moves lower but buyers regain control before the candle closes.
This typically produces a noticeable lower wick.
Bullish Rejection Story
1. Sellers push price lower.
2. Buyers become active at lower prices.
3. The market recovers.
4. Candle closes well above its low.
Lower prices were rejected.
What Is Bearish Rejection?
Bearish rejection happens when buyers initially move price higher but sellers overwhelm that advance before the candle closes.
The result is often a prominent upper wick.
Bearish Rejection Story
1. Buyers push price higher.
2. Sellers become aggressive at higher prices.
3. The market falls back.
4. Candle closes well below its high.
Higher prices were rejected.
What Is a Pin Bar?
A pin bar is a popular name for a candlestick with a relatively small body and a prominent wick extending from one side.
The long wick represents the price area that failed to hold.
Basic Pin Bar Anatomy
Long Wick: Shows the rejected price area.
Small Body: Shows price finished far away from the wick extreme.
Close: Ideally positioned toward the opposite side of the rejection.
Anatomy of a Bullish Pin Bar
A bullish pin bar typically has a long lower wick and a smaller body toward the upper portion of the candle.
Long Lower Wick
Sellers pushed lower but could not maintain control.
Body Near Top
Much of the bearish move was recovered.
Strong Close
Buyers finished the period in a stronger position.
Anatomy of a Bearish Pin Bar
A bearish pin bar normally has a long upper wick with the body positioned toward the lower part of the candle.
Long Upper Wick
Buyers pushed higher but failed to hold the move.
Body Near Bottom
Most of the bullish move was given back.
Weak Close
Sellers controlled the end of the period.
Does the Color of a Pin Bar Matter?
Less than many beginners think.
A bullish rejection candle can technically close slightly below its open and still show powerful rejection of lower prices.
Likewise, a bearish rejection candle may close marginally above its open while still showing strong rejection from a resistance area.
The relationship between the wick, body, close and market location matters more than simply whether the candle is green or red.
Wick-to-Body Relationship
A quality rejection candle generally has a wick that is clearly significant relative to its body.
There is no universal mathematical ratio that every pin bar must satisfy, but the rejection should be visually obvious.
Clear Rejection
Large Wick + Compact Body
Weak Signal
Tiny Wick + Large Body
Location Is More Important Than the Pattern
A perfect-looking pin bar in the middle of random price action may be almost meaningless.
The same candle at a major structural level can become much more important.
High-Quality Rejection Context
✓ Major support or resistance
✓ Previous swing high or low
✓ Higher-timeframe zone
✓ Liquidity sweep
✓ Trend pullback
✓ Structure-change area
Why Random Pin Bars Fail
Candlestick charts naturally produce long wicks.
If you scroll through enough charts, you can find pin bars everywhere.
That does not mean every one represents an actionable reversal.
Weak Approach
“I found a pin bar, therefore I enter.”
Better Approach
“Price reached an important area, attempted to break it, failed, closed back inside and now I am watching for confirmation.”
Bullish Rejection at Support
One of the most logical places to evaluate bullish rejection is around meaningful support.
Example Sequence
1. Higher timeframe remains bullish.
2. Price pulls back toward support.
3. Sellers briefly push through support.
4. Buyers aggressively reclaim the level.
5. Candle leaves a long lower wick.
6. Price closes back above support.
The wick becomes meaningful because lower prices were rejected at a location where buyers already had a reason to become interested.
Bearish Rejection at Resistance
1. Market approaches major resistance.
2. Buyers push above the previous high.
3. Breakout fails.
4. Sellers push price back below resistance.
5. Candle forms a long upper wick.
6. Candle closes near the lower portion of its range.
Rejection After a Liquidity Sweep
This connects directly to what you learned in Module 2.
Previous highs and lows can contain clusters of stop orders and breakout orders.
Price may move through that area, trigger those orders, and then immediately reject.
Powerful Context Sequence
Liquidity Sweep → Rejection Wick → Close Back Inside → Structure Shift
Rejection becomes stronger information when price first fails beyond an important structural level.
Rejection Candles and False Breakouts
A rejection candle can be the visual evidence left behind by a false breakout.
Resistance: 1.1000
Price trades to: 1.1020
Breakout buyers enter.
Sellers push price back below 1.1000.
Candle closes at 1.0985 with a long upper wick.
That candle communicates something very different from a candle that closes strongly at 1.1020 and continues higher.
Rejection Wick vs. Genuine Breakout
| Characteristic |
Rejection |
Breakout |
| Movement Beyond Level |
Temporary |
Sustained |
| Candle Close |
Returns inside |
Closes beyond level |
| Wick |
Often prominent |
May be limited |
| Follow-Through |
Moves opposite failed break |
Continues breakout direction |
The Close Separates Exploration From Acceptance
During the candle, price may move anywhere.
The close tells you where price ultimately finished.
Exploration
Price trades above resistance during the candle.
Rejection Confirmed
Candle closes back underneath resistance.
A wick shows where price went. The close shows where price finished.
Why Rejection Still Needs Confirmation
A rejection candle shows that one attempt failed.
It does not guarantee the market will reverse.
Price can reject an area temporarily and then return moments later to break through it successfully.
Possible Confirmation After Rejection
✓ Strong candle in reversal direction
✓ Break of minor structure
✓ CHoCH
✓ Failed retest
✓ Momentum shift
✓ Follow-through away from level
Rejection + Change of Character
One of the strongest ways to add context is to combine rejection with a structural change.
Bullish Example
Sweep Low → Bullish Rejection → Break Previous Lower High → Retest → Potential Entry
Instead of buying simply because a long lower wick appeared, you wait for evidence that buyers have actually begun changing the short-term structure.
Watch What the Next Candle Does
The candle immediately after rejection can provide useful information.
Confirmation
Strong bullish rejection is followed by another bullish candle that breaks nearby structure.
Failure
Bullish rejection is immediately followed by heavy selling that breaks beneath the wick low.
Rejection With the Trend vs. Against the Trend
Rejection can be used for continuation or reversal setups.
Trend Continuation
Bullish trend pulls back to support and prints bullish rejection before continuing higher.
Potential Reversal
Extended bullish trend sweeps major resistance and produces bearish rejection plus a structural shift.
Countertrend rejection generally deserves more confirmation because you are attempting to trade against the direction that previously controlled the market.
Multi-Timeframe Rejection
Rejection becomes especially useful when a lower-timeframe candle confirms a higher-timeframe price level.
4H: Major bullish support.
1H: Price enters support zone.
15M: Sell-side liquidity is swept.
5M: Strong bullish rejection candle forms.
Now the five-minute rejection candle is supported by a much larger market story.
Strong Rejection vs. Weak Rejection

 11 min
 12 min
 14 min