Module 6 · Trading Psychology, Discipline & Emotional Control · Lesson 3
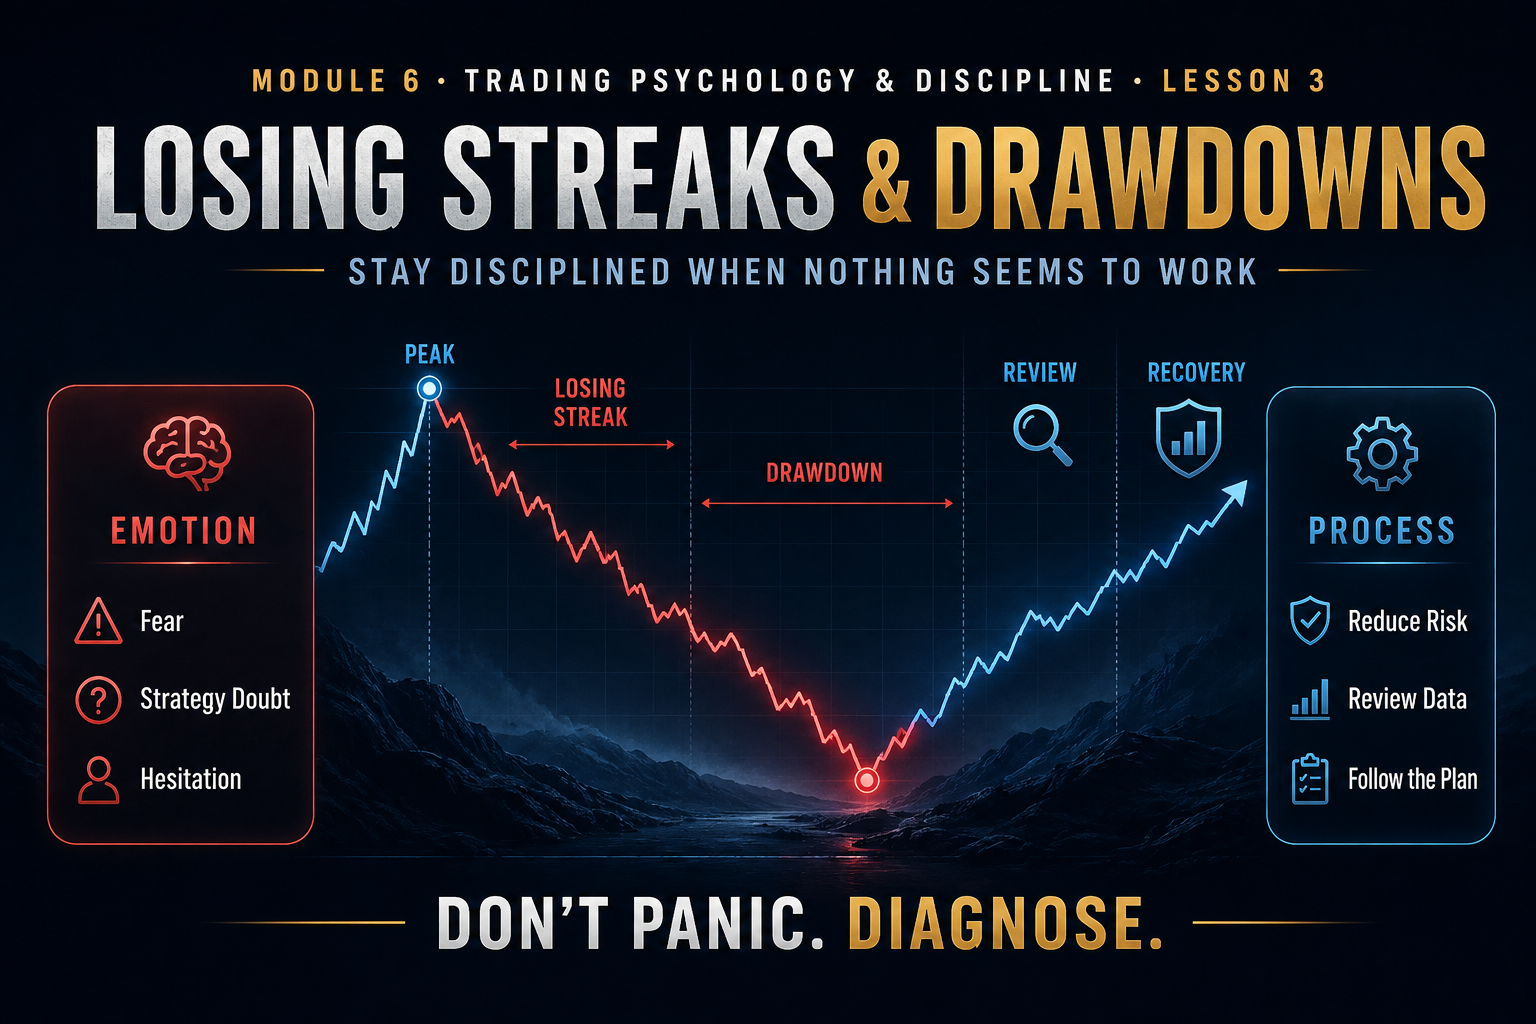
Losing Streaks & Drawdowns: How to Stay Disciplined When Nothing Seems to Work
Learn how to handle consecutive losses, understand drawdown mathematics, protect confidence, distinguish normal variance from genuine strategy problems and keep one difficult period from destroying a sound trading process.
Losing Streaks
Drawdown
Variance
Discipline
One losing trade is usually easy to explain.
Five losing trades in a row feel different.
Confidence starts to disappear. Every setup looks suspicious. The trader begins wondering whether the strategy has stopped working, whether the market has changed, or whether they have suddenly lost their ability to trade.
This is where discipline gets tested.
A losing streak does not automatically mean the strategy is broken. It does mean your risk, execution and decision-making deserve careful review.
The objective is neither to blindly continue nor panic and rebuild everything. The objective is to respond to drawdown with evidence.
Lesson Objectives
What You’ll Learn
✓ Why losing streaks are inevitable
✓ How drawdown affects recovery
✓ What normal variance looks like
✓ When strategy review is justified
✓ How to reduce emotional pressure
✓ How to rebuild confidence correctly
What Is a Losing Streak?
A losing streak is simply a sequence of consecutive losing trades.
It can happen even when every trade follows the strategy correctly.
Loss → Loss → Loss → Loss → Loss
The emotional difficulty comes from the sequence, not from the fact that any individual loss was unusual.
Losing Streaks Exist Even in Profitable Systems
A strategy with a strong historical win rate can still produce multiple losses in a row.
Example Strategy: 55% historical win rate
Loss Rate: 45%
A 45% chance of losing one trade means consecutive losses are not mathematically surprising.
Win rate does not tell you the order in which wins and losses will occur.
The Order of Outcomes Can Be Messy
Traders often imagine a 60% win-rate system like this:
Win · Win · Loss · Win · Loss · Win · Win · Loss
Real sequences may look more like:
Loss · Loss · Loss · Win · Win · Loss · Win · Win · Win
Same general expectancy. Very different emotional experience.
What Is Drawdown?
Drawdown measures the decline from a previous account peak to a later low.
Account Peak: $10,000
Current Equity: $9,200
Drawdown: $800 = 8%
Drawdown Changes the Mathematics of Recovery
| Drawdown |
Approx. Gain Needed to Recover |
| -5% |
+5.3% |
| -10% |
+11.1% |
| -20% |
+25% |
| -30% |
+42.9% |
| -50% |
+100% |
The deeper the drawdown, the harder the recovery. Capital protection matters most when things are going badly.
The Worst Response Is Usually Increasing Risk
When confidence falls, some traders increase risk because they want to escape drawdown faster.
Normal risk: 1%
After losing streak: 3%
Reason: “One winner will get me back.”
Drawdown risk increases precisely when confidence and decision quality are already under pressure.
Normal Variance vs. Strategy Failure
This is one of the most important distinctions in trading.
Possible Normal Variance
Setups still meet rules.
Execution remains consistent.
Losses occur within historical expectations.
Market conditions still suit the strategy.
Possible Process Problem
Rules are being broken.
Setup quality has declined.
Market regime has changed materially.
Results differ significantly from tested expectations.
Do Not Change the Strategy After Every Losing Streak
A common cycle looks like this:
Strategy A Loses
↓
Switch to Strategy B
↓
Strategy B Loses
↓
Switch to Strategy C
↓
Never Build a Meaningful Sample
Constant strategy switching can make it impossible to determine whether any method actually has an edge.
Sample Size Matters
Five trades tell you very little about a trading system.
5 trades: Extremely small sample.
20 trades: More information, still limited.
50+ trades: More useful for evaluating patterns.
Larger tested sample: Better basis for judging expectancy and drawdown behavior.
Do not make major strategic conclusions from tiny emotional samples.
First Review Execution, Not Just Results
Did every trade meet setup criteria?
Were entries taken at the correct time?
Were stops based on invalidation?
Was risk consistent?
Were targets realistic?
Was news respected?
Were any trades taken because of frustration or fear?
A Losing Streak of Good Trades Is Different From a Losing Streak of Bad Trades
Good Losses
Valid setups, correct risk, correct stops, no emotional interference. Results simply did not work in this sequence.
Bad Losses
FOMO entries, oversizing, news trades, revenge trades, weak setups and rule violations.
The first may require patience. The second requires correction.
Losing Streaks Damage Confidence
After repeated losses, traders often begin hesitating on valid setups.
Setup meets every rule.
Trader remembers previous losses.
Trader skips the entry.
Trade reaches target.
Recent outcomes have begun controlling future execution.
Confidence Should Come From Process — Not Certainty
Healthy trading confidence does not mean believing the next trade will win.
Healthy Confidence:
“I do not know what this trade will do, but I know exactly how I will execute it.”
Reducing Risk During Drawdown
Some traders reduce position risk during periods of meaningful drawdown.
Normal risk: 1%
Drawdown risk: 0.5%
Smaller risk can reduce both account pressure and emotional pressure.
This should be a predefined rule, not an impulsive reaction after one losing trade.
Why Lower Risk Can Help
Slows further drawdown.
Reduces emotional intensity.
Makes it easier to continue following the process.
Creates space to evaluate whether the edge is still behaving normally.
Stopping Completely Can Also Become Emotional
Some traders respond to drawdown by refusing to take any more trades.
That can be appropriate if the plan calls for a review. But stopping indefinitely because of fear can create a new problem.
A pause should have a purpose: review, diagnose, reset and return under defined conditions.
Rebuild Confidence With Smaller Stakes
If emotional pressure is affecting execution, returning at reduced size can help rebuild trust in the process.
Review → Reduce Risk → Execute Correctly → Gather Data → Restore Normal Risk Gradually
Do Not Try to Recover Drawdown Quickly
The desire to recover quickly is often what turns manageable drawdown into severe drawdown.
Account down 5%.
Trader decides to double risk.
Two more losses occur.
The recovery plan creates a deeper drawdown.
The fastest way out of drawdown is not necessarily the safest way out of drawdown.
Stable Risk Creates Stable Decision-Making
When risk stays controlled, a streak remains mathematically manageable.
5 losses at 0.5% risk = approximately 2.5% gross risk before compounding effects.
5 losses at 3% risk = approximately 15% gross risk before compounding effects.
Same losing streak. Completely different damage.
When Should You Review the Strategy?
Review should be triggered by evidence, not panic.
Drawdown exceeds historical expectations.
Win rate deteriorates significantly over a meaningful sample.
Average winner or loser changes materially.
Market conditions no longer resemble tested conditions.
Execution quality remains high but results remain unusually poor.
Strategy logic itself may no longer fit the current environment.
Market Regimes Can Change
A strategy designed for trending markets may struggle during extended choppy conditions.
Trend Environment
Breakouts and continuation strategies may perform well.
Range Environment
The same breakout system may experience more false moves.
This does not automatically mean the strategy is permanently broken. It may mean the environment is different.
The Journal Becomes Critical During Drawdown
Memory becomes unreliable when confidence is low.
Record each setup.
Record whether rules were followed.
Record session and market conditions.
Record R result.
Record emotional state.
Look for patterns across the whole sample.
During drawdown, data should become louder than emotion.
Diagnose the Drawdown
Strategy
Is the edge behaving differently?
Execution
Are rules being followed?
Market
Has the regime changed?
Psychology
Is emotional interference increasing?
Example: Normal Losing Streak
Case Study
Trade 1: Valid setup → -1R
Trade 2: Valid setup → -1R
Trade 3: Valid setup → -1R
Trade 4: Valid setup → -1R
Free Academy Access
Unlock the rest of this lesson free
Sign in to continue, or create a 100% free Academy account and unlock the full member experience.
ALREADY A MEMBER?
Sign In & Continue
Access the rest of this lesson instantly.
Forgot password?

 12 min
 11 min
 12 min