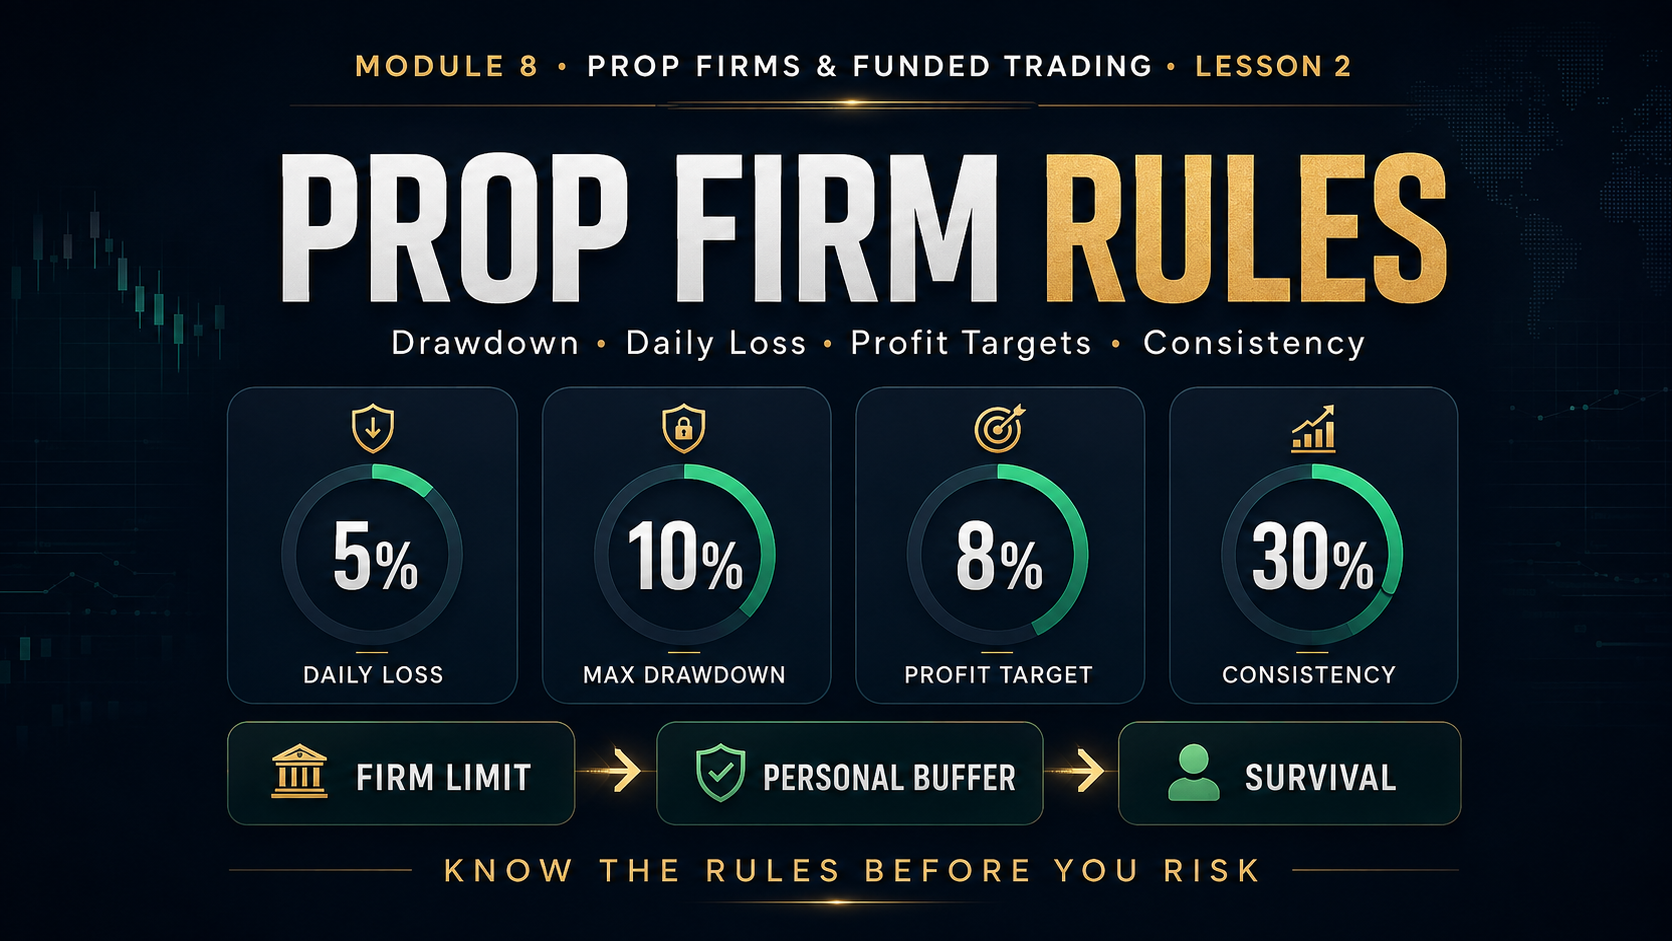
Module 8 · Prop Firms & Funded Trading · Lesson 2
Prop Firm Rules: Drawdown, Daily Loss, Profit Targets & Consistency
Learn how the most important prop firm rules are calculated, how daily and total drawdown interact, how trailing limits can move against you and how consistency rules affect both challenge passing and funded payouts.
Daily Loss
Max Drawdown
Profit Targets
Consistency Rules
Most prop firm failures are not caused by a trader misunderstanding how to enter a trade.
They happen because the trader misunderstands — or ignores — the account rules.
A setup can be technically correct and still be the wrong trade for a funded account if the position size, timing or open exposure pushes the account too close to a drawdown limit.
In prop trading, a good trade taken with bad rule awareness can still fail the account.
This lesson focuses on the numbers that define the boundaries of the account and how to build your own internal limits before the firm’s limits are ever reached.
Lesson Objectives
What You’ll Learn
✓ How daily drawdown works
✓ How maximum drawdown works
✓ Static vs trailing drawdown
✓ How equity-based rules affect open trades
✓ How profit targets should be approached
✓ How consistency rules can affect payouts
Rule #1: Know the Exact Formula — Not Just the Percentage
Two firms can both advertise a 5% daily loss limit and still calculate that limit differently.
Possible Calculation Inputs:
Starting balance
Start-of-day balance
Start-of-day equity
Highest intraday equity
Closed P&L plus unrealized P&L
The percentage alone is not enough. The calculation method determines the actual risk.
What Is a Daily Loss Limit?
A daily loss limit defines the maximum amount the account may lose during a single trading day before violating the program.
Simplified Example
Account: $100,000
Daily Loss Limit: 5%
Simplified Daily Loss Allowance: $5,000
But the real number may depend on how the firm calculates daily loss and when its trading day resets.
Closed Losses May Not Be the Whole Calculation
Some rules also include unrealized losses from open positions.
Closed loss today: -$2,000
Open floating loss: -$2,500
Combined intraday loss exposure: -$4,500
A trader looking only at closed trades may believe there is much more room than actually exists.
Know When the Daily Limit Resets
Daily drawdown usually resets at a defined time, but that reset may not match your local midnight.
Firm server time
New York market time
UTC-based reset
Another specifically published reset time
Never guess when a daily loss limit resets. Verify the exact time in the current program rules.
Your Personal Daily Stop Should Usually Come First
The firm’s limit is an emergency boundary — not necessarily the amount you should plan to lose.
Firm Maximum
5%
Account fails if breached.
Personal Daily Stop
Example: 1%–1.5%
Trading stops much earlier.
The percentages above are educational examples only and are not recommendations.
Why Keep a Buffer?
Protects against accidental overexposure
Protects against spread widening
Protects against slippage
Reduces revenge-trading pressure
Preserves room for future sessions
What Is Maximum Drawdown?
Maximum drawdown is the total loss boundary of the account.
Account: $100,000
Maximum Drawdown: 10%
Simplified Failure Level: $90,000
Under a simple static model, the account cannot fall below that floor.
Static Drawdown
Static drawdown generally keeps the failure threshold at a fixed level.
Starting account: $100,000
Static floor: $90,000
Account grows to $106,000.
Static floor remains $90,000 under this simplified example.
Static drawdown can provide increasing breathing room as the account builds profit.
Trailing Drawdown
A trailing drawdown can move upward as the account reaches higher values.
Starting account: $100,000
Starting trailing threshold: $95,000
Equity rises to: $104,000
If the threshold trails by $5,000, it may move to: $99,000
The exact mechanics differ by program, but the key idea is that successful trading can cause the loss floor to rise.
Why Trailing Drawdown Can Be Tricky
Account reaches a new equity high.
Trailing threshold rises.
Trader gives profit back.
The account may now have less usable drawdown than the trader expects.
Intraday Trailing vs. End-of-Day Trailing
| Method |
General Behavior |
| Intraday Trailing |
Threshold may react to new equity highs during the session. |
| End-of-Day Trailing |
Threshold may update based on a defined end-of-day value instead of every intraday fluctuation. |
Equity-Based Drawdown
Equity-based rules can make open positions especially important.
Balance: $102,000
Open floating loss: -$4,000
Current equity: $98,000
If the firm monitors equity, the account is effectively at $98,000 for risk-rule purposes even though the closed balance says $102,000.
Open Risk Counts Before the Stop Is Hit
Traders sometimes calculate risk trade by trade while ignoring the combined effect of multiple positions.
EUR/USD risk: 1%
GBP/USD risk: 1%
XAU/USD risk: 1%
Total open planned risk: 3%
If those positions are correlated, the true scenario risk may be even more concentrated.
Correlated Positions Can Create Hidden Exposure
Long EUR/USD
Long GBP/USD
Short USD/CHF
These positions may all express a similar broad USD view.
Three different symbols do not necessarily equal three independent risks.
Understanding the Profit Target
The profit target defines how much the account must gain before an evaluation phase is completed.
Account: $100,000
Profit target: 8%
Target balance under a simple model: $108,000
Profit Target vs. Drawdown
The relationship between the target and the loss allowance tells you how demanding the evaluation may be.
Profit Target: +8%
Maximum Drawdown: -10%
Daily Drawdown: -5%
You need to make progress toward the target while never crossing either loss boundary.
Do Not Turn the Profit Target Into a Deadline
Target remaining: 3%
Trader thinks: “I should finish today.”
Position size increases.
Setup standards fall.
Account risk rises.
The target is an account requirement. It should not become an emotional demand.
Better Approach
Keep normal risk.
Take only qualified setups.
Allow the target to be reached through accumulated edge.
Do not change strategy because the finish line is close.
What Is a Profit Consistency Rule?
A consistency rule generally limits how much of total profit can come from one trading day or one trade.
Best Day Profit ÷ Total Profit ≤ Allowed Consistency Percentage
Total profit: $10,000
Best day: $4,000
Best day represents: 40% of total profit.
If a program limits the best day to 30% of total profit, additional smaller profitable days may be needed before payout eligibility.
Consistency Rules Do Not Always Mean an Immediate Failure
Depending on the program, exceeding a consistency threshold may mean the trader needs to build more profit before qualifying for a payout rather than losing the account immediately.
The consequence depends on the exact program. Never assume what a consistency violation means.
Example: How More Profit Can Improve Consistency
| Best Day |
Total Profit |
Best Day % |
| $3,000 |
$6,000 |
50% |
| $3,000 |
$8,000 |
37.5% |
| $3,000 |
$10,000 |
30% |
Lot-Size Consistency Rules
Some programs may also limit how dramatically your position size can change from trade to trade.
Typical size: 1 lot
Next trade: 8 lots
A sudden size increase may violate or complicate consistency requirements under some programs.
Minimum Trading Days
Some evaluations or payout systems require activity across a minimum number of separate trading days.
Profit target reached in two days.
Program requires five minimum trading days.
The trader may still need to satisfy the remaining activity requirement.
Minimum trading days should not become an excuse to take low-quality trades.
News Trading Rules
Some prop programs permit news trading while others restrict entering, holding or closing trades during specific event windows.
Are new entries allowed?
Can existing positions remain open?
Does the rule apply only to funded accounts?
How many minutes before or after the release?
Which economic events are classified as restricted?
Overnight & Weekend Holding Rules
A swing-trading strategy may be incompatible with a program that requires positions to be closed before certain sessions or weekends.
Strategy requires multi-day holds.
Program restricts weekend exposure.
The strategy and account rules may not be compatible.
Prohibited Trading Methods
Some firms restrict certain techniques, software, execution methods or forms of account coordination.
Certain arbitrage methods
Latency exploitation
Account sharing
Unauthorized copy trading
Restricted EAs or automation
Other specifically prohibited conduct
The exact restrictions vary. Read the current terms before deploying any automated or unusual strategy.
Build Internal Limits Inside the Firm’s Limits
A professional risk plan should create space between your normal behavior and the account’s failure threshold.
Educational Example
Firm Daily Loss: 5%
Personal Daily Stop: 1.5%
Firm Total Drawdown: 10%
Personal Review Trigger: -4%
Risk Per Trade: 0.5%
Maximum Trades Per Day: 3
Example values are for education only. They are not personalized risk recommendations.
Think in Buffers
Firm Limit ≠ Trading Target
Create Space Between Normal Risk and Failure
Profit Can Create a Protective Buffer
Depending on the drawdown model, accumulated profits may create more room between current equity and the failure threshold.
Starting balance: $100,000
Static failure floor: $90,000
Current balance: $105,000
Distance to static floor: $15,000
This is one reason protecting early profits can be more valuable than immediately increasing risk.

 13 min
 13 min
 13 min