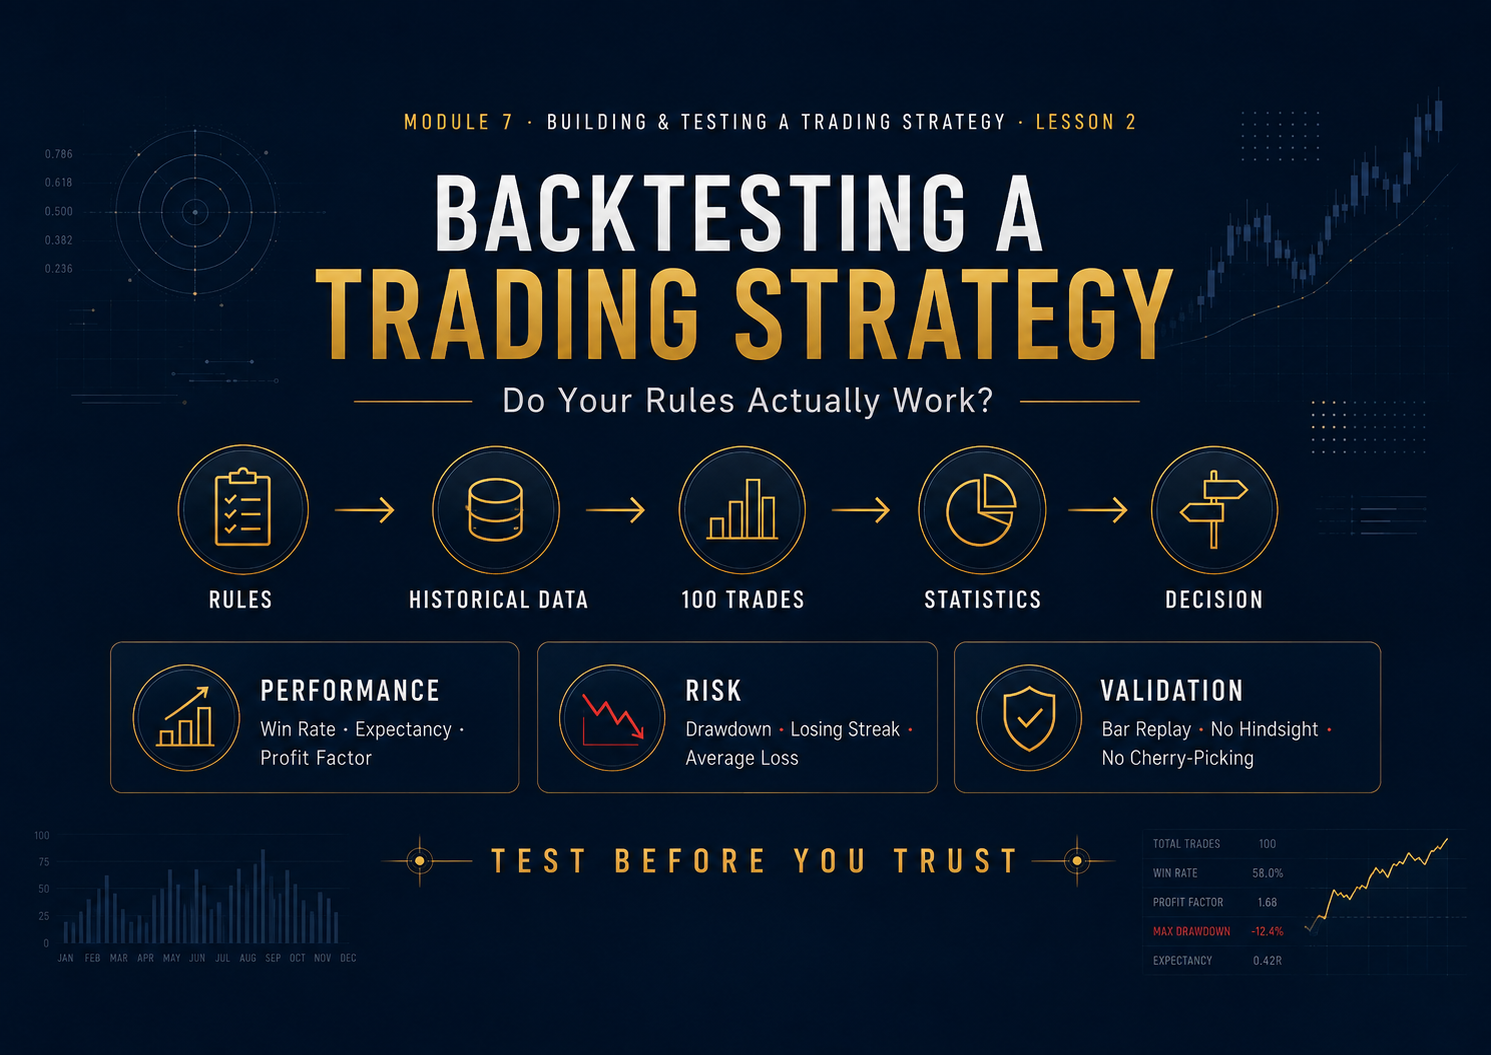
Module 7 · Building & Testing a Complete Trading Strategy · Lesson 2
Backtesting a Trading Strategy: How to Find Out if Your Rules Actually Work
Learn how to test a rule-based trading strategy against historical price action, avoid hindsight bias, build a meaningful sample and collect the statistics needed to determine whether your setup shows a repeatable edge.
Backtesting
Historical Data
Sample Size
Expectancy
A strategy can sound excellent and still fail when tested.
That is exactly why backtesting matters.
Backtesting means taking the exact rules created in Lesson 1 and applying them to historical market data as if you were trading those conditions in real time.
The goal is not to prove that your strategy is good.
The goal of backtesting is to discover the truth about the strategy before real money forces you to discover it the expensive way.
A proper backtest should challenge your assumptions, expose weaknesses and produce data you can use to make better decisions.
Lesson Objectives
What You’ll Learn
✓ What backtesting actually measures
✓ How to test without hindsight bias
✓ How many trades to collect
✓ Which statistics matter most
✓ How to track drawdown and losing streaks
✓ How to avoid over-optimizing the test
What Is Backtesting?
Backtesting is the process of applying a fixed trading strategy to historical market data and recording what would have happened if the rules had been followed exactly.
Fixed Rules → Historical Data → Recorded Trades → Statistics → Evaluation
The emphasis is on fixed rules. If you change the strategy every time a historical trade loses, you are no longer testing one strategy.
What a Backtest Can Tell You
How often the strategy wins
How large the average winner is
How large the average loser is
How often losing streaks occur
What drawdown may look like
Which sessions or markets perform best
Whether certain filters improve results
Whether the overall system appears to have positive expectancy
What a Backtest Cannot Tell You
✕ It cannot guarantee future performance.
✕ It cannot recreate every live execution condition perfectly.
✕ It cannot guarantee the same spread or slippage.
✕ It cannot remove future market-regime changes.
✕ It cannot compensate for poor rule-following in live trading.
Backtesting gives evidence — not certainty.
Freeze the Strategy Before You Start
Before the first historical trade is reviewed, your Version 1 rules should already be written.
Market: Defined
Session: Defined
Context: Defined
Trigger: Defined
Stop: Defined
Target: Defined
Risk: Defined
Now you are testing the strategy instead of redesigning it one chart at a time.
The Biggest Enemy: Hindsight Bias
Historical charts make everything look obvious because you can already see what happened next.
You see price later rally 300 pips.
Suddenly the earlier long setup looks “obvious.”
You unconsciously interpret every ambiguous candle in favor of the trade.
Future information contaminates the historical decision.
Use Bar Replay When Possible
One of the best ways to reduce hindsight bias is to hide future candles and reveal price one bar at a time.
1. Choose an older historical period.
2. Hide candles to the right.
3. Advance one candle at a time.
4. Make decisions only from visible information.
5. Record the trade before revealing the outcome.
Trade the Past as if You Do Not Know the Future.
Test Chronologically
Move through the market in order rather than jumping around looking for attractive examples.
January → February → March → April → May
This forces the strategy to experience quiet periods, ugly periods and losing streaks — not just the beautiful examples you would choose for a screenshot.
Never Cherry-Pick Only the Best Setups
Strong winner? Record it.
Ugly loser? Record it.
Breakeven? Record it.
Setup qualified but looked uncomfortable? Record it.
If the rules say it qualifies, the test must include it.
Record Every Qualifying Signal
A proper backtest is not a gallery of favorite trades.
Qualifies + Winner → Record
Qualifies + Loser → Record
Qualifies + Breakeven → Record
Does Not Qualify → Skip
What Should You Record?
| Field |
Why It Matters |
| Date |
Allows chronological analysis |
| Instrument |
Compare market performance |
| Session |
Compare timing quality |
| Setup Type |
Separate strategy variations |
| Direction |
Long vs short performance |
| Entry |
Execution reference |
| Stop |
Defines 1R |
| Target |
Measures planned reward |
| Result in R |
Standardizes performance |
| Screenshot |
Allows later visual review |
Measure Results in R-Multiples
R allows trades with different stop distances and account sizes to be compared consistently.
1R: Planned amount at risk
Full Loss: -1R
2:1 Target Hit: +2R
Half-R Winner: +0.5R
Breakeven: 0R
How Many Trades Should You Backtest?
There is no magic number, but very small samples can be misleading.
10 Trades
Far too small for strong conclusions.
30 Trades
Early information only.
50–100+
More useful for identifying patterns.
The more variable the strategy and market environment, the more valuable a larger sample becomes.
Test Across Different Market Conditions
Trending markets
Range-bound markets
High-volatility periods
Low-volatility periods
Different months and economic environments
A strategy that works only during one unusually strong trend may not be robust enough for general use.
Do Not Mix Markets Without Tracking Them Separately
EUR/USD: 80 trades
GBP/USD: 80 trades
XAU/USD: 80 trades
You may later combine results, but separate tracking allows you to see whether one market is carrying the entire strategy.
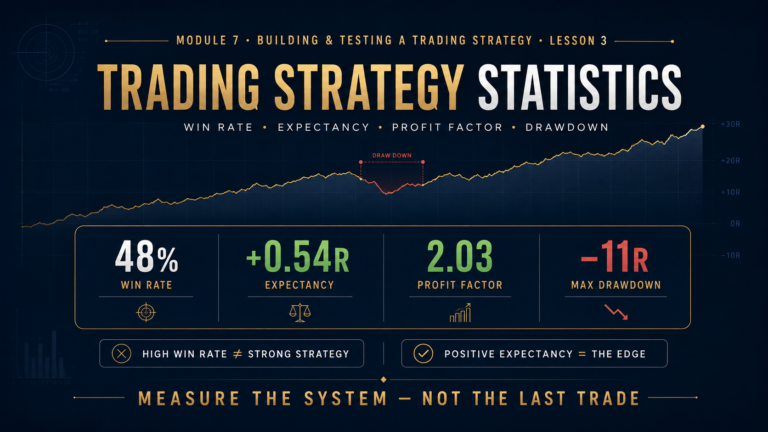
Statistic #1: Win Rate
Win Rate = Winning Trades ÷ Total Trades × 100
60 winning trades ÷ 100 total trades = 60% win rate
Win rate is important, but it means very little without average winner and average loser.
Statistic #2: Average Winner & Average Loser
Average Winner: +2R
Average Loser: -1R
A strategy can be profitable with a lower win rate if the average winner is sufficiently larger than the average loser.
Statistic #3: Expectancy
Expectancy estimates the average amount a strategy is expected to make or lose per trade across a large sample.
Expectancy = (Win Rate × Avg Win) − (Loss Rate × Avg Loss)
Win Rate: 45%
Average Winner: +2R
Loss Rate: 55%
Average Loser: -1R
Expectancy = +0.35R per trade
Statistic #4: Equity Curve
Add each trade’s R result in chronological order.
0R → +2R → +1R → 0R → +2R → +4R → +3R…
The equity curve shows not just whether the strategy made money, but how difficult the journey was.
Statistic #5: Maximum Drawdown
Maximum drawdown shows the largest decline from an equity peak to a later trough during the test.
Equity reaches: +18R
Then declines to: +10R
Maximum drawdown during that decline = -8R
A profitable strategy with extreme drawdown may still be unsuitable for your risk tolerance.
Statistic #6: Maximum Losing Streak
If your backtest shows five or six consecutive losses are normal, you should not be shocked when a similar sequence appears live.
Backtesting prepares you psychologically for the ugly parts of the strategy too.
Statistic #7: Profit Factor
Profit factor compares total winning profits with total losing losses.
Profit Factor = Gross Profit ÷ Gross Loss
Gross profit: 80R
Gross loss: 50R
Profit factor = 1.60
Statistic #8: Trade Frequency
Two profitable strategies can feel completely different if one trades twice per month and another trades twice per day.
Trades per week
Trades per month
Average time between setups
Average time spent in a trade
Break Results Down by Session
| Session |
Trades |
Win Rate |
Net R |
| London |
60 |
58% |
+24R |
| New York |
60 |
43% |
+5R |
This may reveal that the core strategy works in both sessions but performs substantially better in one.
Break Results Down by Setup Type
Break & Retest: +18R
Liquidity Sweep Reversal: +11R
Range Breakout: -4R
Without setup labels, you might never discover that one variation is dragging down the rest.
Compare Long and Short Performance
Long Trades
55 trades · +21R
Short Trades
52 trades · +4R
Test Strategy Filters Separately
If you suspect a filter improves performance, test it objectively instead of simply assuming.
Version A: All qualifying setups.
Version B: Same strategy, but exclude trades near high-impact news.
Compare results using a meaningful sample before changing the official strategy.
Beware of Overfitting
Overfitting happens when rules are adjusted so specifically to historical data that they may not generalize well to new market conditions.
Strategy loses on Tuesdays.
Remove Tuesdays.
Then losses occur at 9:45.
Remove 9:45 setups.
Then losses happen when RSI is 56.
Rules become increasingly designed around the past instead of the trading idea.
A simpler strategy that survives many conditions can be more valuable than a perfect-looking historical curve built with dozens of filters.
Include Realistic Trading Costs
A backtest that assumes perfect execution can make marginal strategies appear better than they really are.
Spread
Commission
Slippage assumptions
Swap / financing where relevant
Realistic entry and exit prices
Watch Out for Intrabar Ambiguity

 12 min
 11 min
 13 min