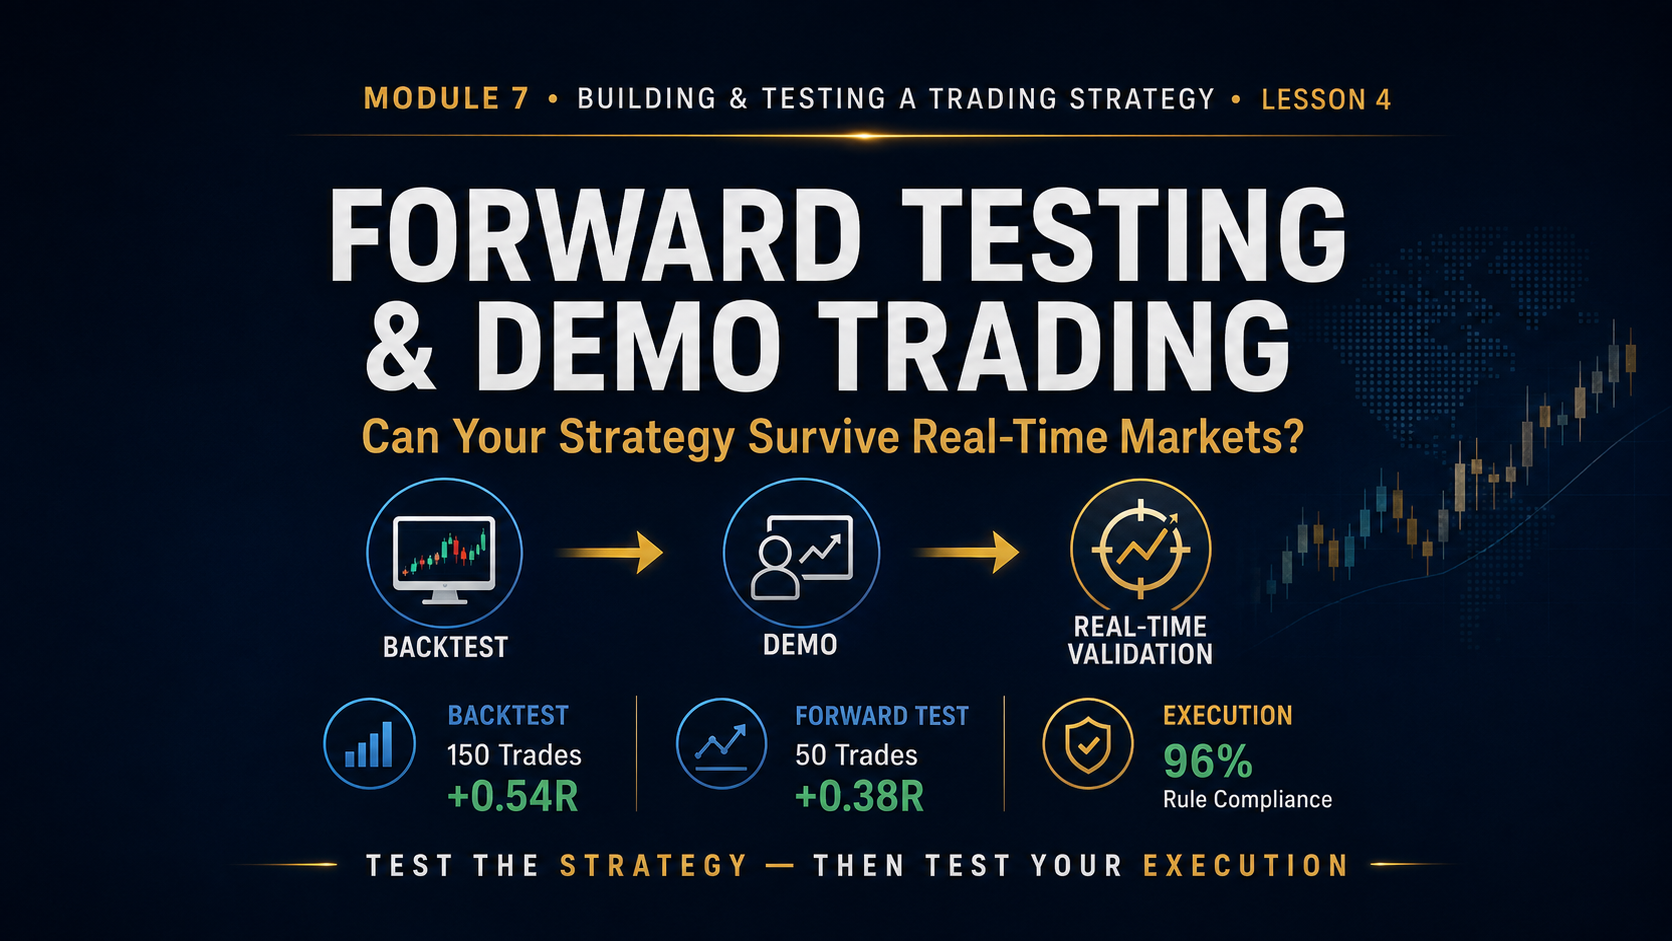
Module 7 · Building & Testing a Complete Trading Strategy · Lesson 4
Forward Testing & Demo Trading: Can Your Strategy Survive Real-Time Markets?
Learn how to test a trading strategy in real time, measure live execution quality, compare results with your backtest and uncover problems that historical charts cannot fully reveal.
Forward Testing
Demo Trading
Execution
Validation
A backtest tells you how a strategy behaved on historical data.
Forward testing asks a different question:
Can you recognize, execute and manage the same strategy correctly when the future is unknown?
Historical charts are useful, but real-time markets introduce waiting, uncertainty, spreads, missed entries, fast candles, changing conditions and emotional pressure.
Forward testing is the bridge between a promising backtest and risking real capital.
Lesson Objectives
What You’ll Learn
✓ What forward testing is
✓ Why demo trading still matters
✓ How live execution differs from backtesting
✓ What to record during forward testing
✓ How to compare live and historical results
✓ When a strategy may be ready for small live risk
What Is Forward Testing?
Forward testing means applying your finalized strategy rules to new market data as it unfolds.
Backtest → New Market Data → Real-Time Decisions → Recorded Results → Validation
The key difference is that the outcome is genuinely unknown when the decision is made.
Backtesting vs. Forward Testing
| Backtesting |
Forward Testing |
| Historical market data |
New market data |
| Can be accelerated |
Must wait for setups |
| Execution may be simulated |
Execution occurs in real time |
| Hindsight can contaminate decisions |
Future candles are genuinely unknown |
Why Demo Trading Is Useful
Demo trading allows you to practice the complete execution process without putting live capital at risk.
Place actual orders.
Use realistic position sizes.
Practice stop-loss placement.
Practice target placement.
Observe spreads and execution.
Learn whether you can follow the strategy patiently.
Demo Trading Is Not Identical to Live Trading
Demo trading removes much of the emotional pressure associated with real financial loss.
A demo stop loss may feel insignificant.
The same stop with real money may feel very different.
Demo validates execution mechanics — not every aspect of live psychology.
Use the Exact Same Strategy Version
Forward testing should validate the strategy you already tested historically.
Strategy Version: 1.0
Entry Rules: Same
Stop Rules: Same
Target Rules: Same
Risk Rules: Same
If you change the strategy immediately after beginning forward testing, you are no longer validating the original backtest.
Forward Testing Reveals the Reality of Waiting
Historical testing can move quickly.
Real markets force you to wait.
Monday: No setup.
Tuesday: No setup.
Wednesday: Setup almost qualifies.
Thursday: Still nothing.
Patience becomes part of the strategy.
Boredom Can Expose Weak Discipline
No qualifying trade appears.
Trader wants activity.
A B-quality setup is upgraded mentally into an A-setup.
The strategy did not create the trade. Boredom did.
Forward Testing Reveals Missed Trades
Backtesting assumes you were available to see every setup.
Real life may prove otherwise.
Setup forms while you are commuting.
Setup forms during a meeting.
Setup forms while you are asleep.
Setup triggers too quickly to execute manually.
A strategy is only useful if you can realistically execute it.
Real-Time Execution Matters
A perfect historical entry may not be available in real time.
Planned entry: 1.1000
Price moves quickly.
Actual available entry: 1.1006
Entry quality and realized R:R may change.
Observe Real-Time Spread
Spreads are not always constant.
Quiet market → tighter spread
Session transition → spread may widen
High-impact news → spread may expand sharply
Illiquid periods → execution can deteriorate
Slippage Can Change Results
Slippage occurs when the actual fill differs from the expected price.
Expected entry: 1950.00
Actual fill: 1950.40
Small differences can matter when stops and targets are tight.
Test the Actual Order Method
Market Entry
Can execution happen quickly enough?
Limit Order
How often is the order actually filled?
Stop Order
How does fast movement affect the fill?
News Filters Become More Real in Forward Testing
A written news filter may seem simple in historical testing.
Setup appears at 8:22.
High-impact release is scheduled at 8:30.
Trade looks excellent.
Forward testing reveals whether you can actually respect the no-trade rule.
Forward Testing Begins Testing You Too
The strategy is not the only thing being tested.
Can you wait for confirmation?
Can you skip an almost-valid setup?
Can you accept a stop without revenge trading?
Can you avoid changing the target after price starts moving?
Can you stop when your trading window ends?
Separate Strategy Results From Execution Errors
| Trade |
Strategy Valid? |
Executed Correctly? |
Result |
| 1 |
Yes |
Yes |
+2R |
| 2 |
Yes |
No — entered late |
+0.6R |
| 3 |
No |
No — FOMO |
-1R |
Without this separation, you may blame the strategy for losses that were actually caused by execution.
What to Record During Forward Testing
Date and time
Instrument
Session
Setup type
Entry price
Stop price
Target price
Planned R:R
Actual R result
Spread / execution notes
Screenshot before entry
Screenshot after exit
Rule compliance
Emotional / execution notes
Build a Meaningful Forward-Test Sample
Five live demo trades are rarely enough to validate anything.
5 Trades
Too small for strong conclusions.
20–30 Trades
Useful early execution information.
50+ Trades
More useful for comparing with historical statistics.
Compare Forward Results With the Backtest
| Metric |
Backtest |
Forward Test |
| Win Rate |
48% |
45% |
| Avg Winner |
+2.2R |
+2.0R |
| Expectancy |
+0.54R |
+0.35R |
| Max Losing Streak |
7 |
5 |
The numbers do not need to match perfectly. The question is whether forward results remain reasonably consistent with the strategy’s historical profile.
What If Forward Results Are Much Worse?
Do not immediately conclude the strategy is broken.
Is the sample too small?
Are you missing qualifying trades?
Are entries consistently late?
Are spreads larger than modeled?
Are you breaking rules?
Has market behavior materially changed?
Was the original backtest overfit?
Measure the Execution Gap
The execution gap is the difference between what the strategy should have produced and what you actually produced.
Strategy-qualified trades: +12R
Your actual execution: +7R
Execution gap = -5R
That gap may come from missed trades, late entries, early exits, skipped winners or unnecessary trades.
Missed Winners Still Matter
Suppose your strategy has a lower win rate but large winners.
You take 4 losing trades.
Then miss the next valid +4R winner.
Missing one important winner can significantly alter the realized strategy statistics.
Consistency Matters More Than Excitement
Same Market · Same Setup · Same Risk · Same Execution
Forward testing should become boring. That is a good sign.
Do Not Change Rules Because of One Live Loss
Trade loses.
Trader adds a new filter.
Next trade loses.
Trader changes the target.
The strategy becomes impossible to validate.
Document Strategy Changes Properly
Version 1.0: Original backtested rules.
Finding: Live entries consistently suffer from poor fills.
Version 1.1: Entry method modified.
Requirement: New version must be tested separately.
Build a Forward-Testing Routine
Daily Validation Routine
1. Check economic calendar.
2. Prepare approved markets.
3. Mark strategy context.
4. Wait for exact setup.
5. Complete pre-trade checklist.
6. Place demo trade exactly as planned.
7. Record execution details.
8. Screenshot final result.
9. Review whether the strategy or execution produced the outcome.
Review Forward-Test Data Weekly
Number of qualifying setups
Number actually taken
Number missed
Rule violations
Average planned R:R
Average realized R
Spread and slippage notes
Emotional or operational problems
Track Setup Capture Rate
Setup capture rate measures how many valid opportunities you actually executed.
Capture Rate = Trades Taken ÷ Valid Setups × 100
Valid setups = 20
Trades taken = 16
Capture rate = 80%
Measure Rule Compliance
30 total trades
27 fully followed the strategy
Rule Compliance = 90%
The goal should move toward extremely high compliance before meaningful live risk is introduced.
Does the Strategy Fit Your Real Life?
Strategy requires monitoring London open.
Trader is consistently asleep during London.
Free Academy Access
Unlock the rest of this lesson free
Sign in to continue, or create a 100% free Academy account and unlock the full member experience.
ALREADY A MEMBER?
Sign In & Continue
Access the rest of this lesson instantly.
Forgot password?

 13 min
 13 min
 12 min