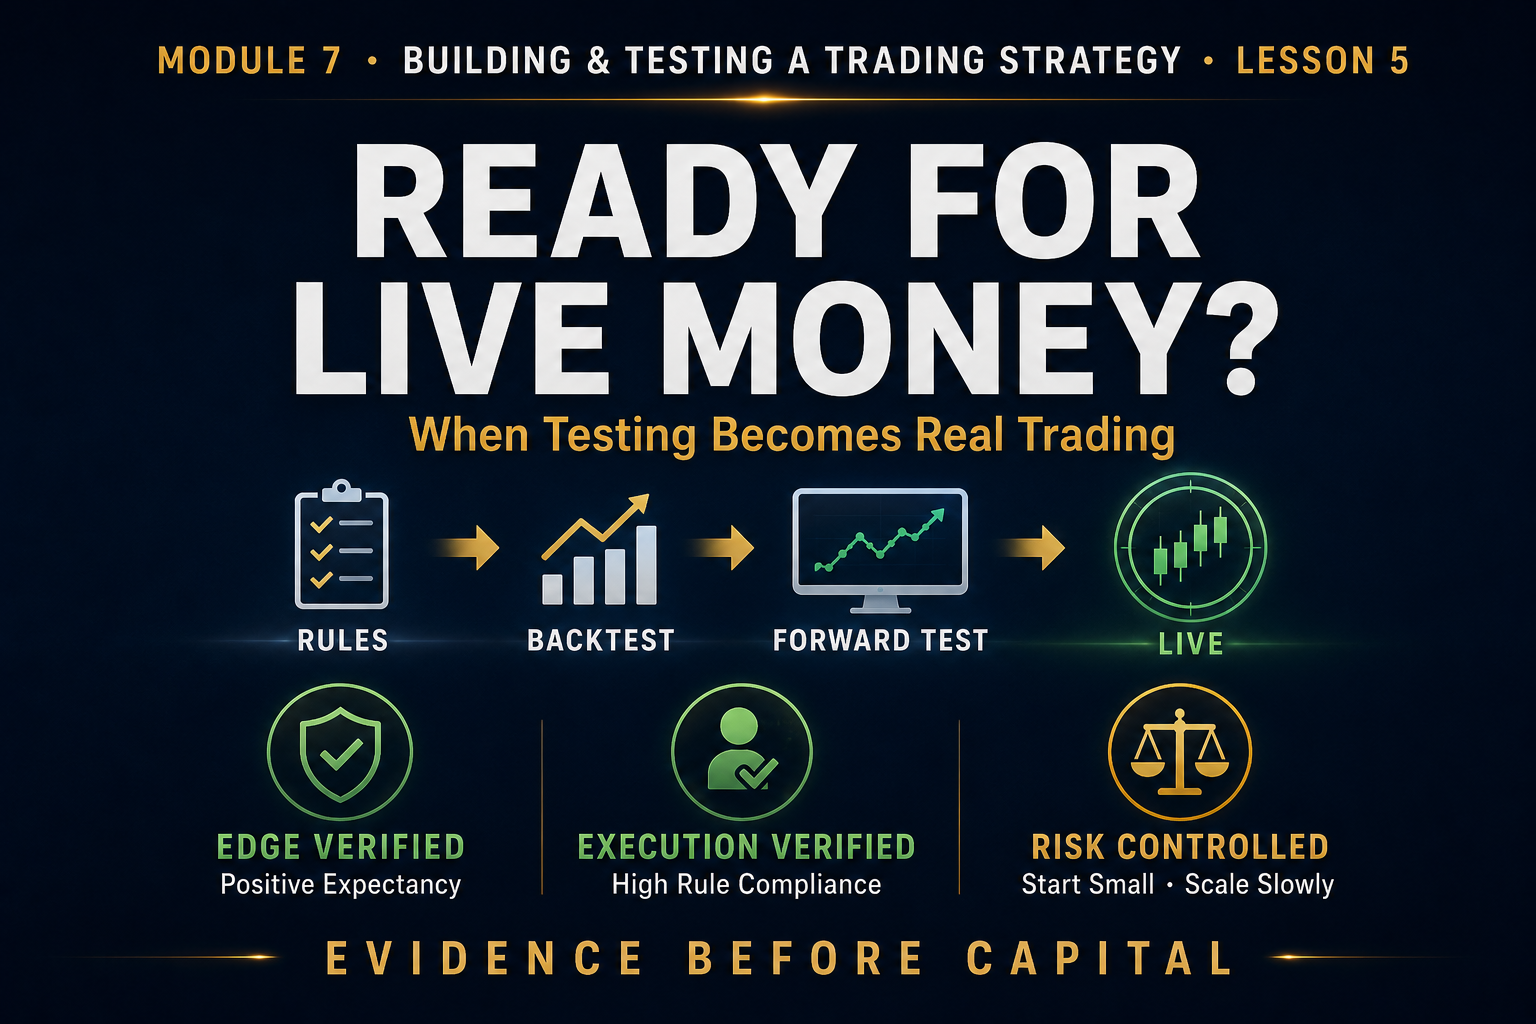
Module 7 · Building & Testing a Complete Trading Strategy · Lesson 5
When Is a Trading Strategy Ready for Live Money?
Learn how to decide when a strategy is ready for live capital, how to begin with controlled risk, when to scale, how to monitor performance drift and when to pause trading and return to testing.
Live Trading
Strategy Validation
Risk Scaling
Performance Monitoring
A positive backtest is not the finish line.
A profitable demo period is not the finish line either.
The real challenge is deciding whether enough evidence exists to expose actual capital to the strategy.
A strategy is not ready for live money because you feel confident. It is ready when its rules, data, execution and risk controls have earned that confidence.
This lesson brings Module 7 together into a complete transition framework from idea to tested strategy to live-market deployment.
Lesson Objectives
What You’ll Learn
✓ What “live ready” actually means
✓ How to build a readiness checklist
✓ How to start with small live risk
✓ How to scale risk responsibly
✓ How to detect performance drift
✓ When to pause and return to testing
What Does “Ready for Live Money” Actually Mean?
A strategy is live-ready when several different types of evidence support the same conclusion.
Clear Rules + Historical Edge + Forward Validation + Execution Discipline + Controlled Risk
No single stage should carry the entire decision.
The Five Layers of Evidence
1. Rule Clarity
The strategy is fully defined.
2. Historical Testing
A meaningful backtest exists.
3. Statistical Edge
Expectancy and risk metrics are acceptable.
4. Forward Validation
Real-time results broadly support the test.
5. Execution Discipline
You can follow the rules consistently.
A Strategy Is Not Ready Just Because the Backtest Made Money
Backtest: +45R
Forward test: only 5 trades
Rule compliance: inconsistent
Historical profitability alone does not make the strategy live-ready.
The Complete Strategy Development Path
IDEA → RULES → BACKTEST → STATISTICS → FORWARD TEST → SMALL LIVE RISK → SCALE
Each stage should solve a different problem before the next stage begins.
Readiness Check #1: Are the Rules Complete?
Approved markets defined
Approved sessions defined
Market context defined
Setup location defined
Exact trigger defined
Entry method defined
Stop-loss rule defined
Target rule defined
Risk per trade defined
News filter defined
Automatic disqualifiers defined
If you still need to decide what the strategy means while money is at risk, the rules are not finished.
Readiness Check #2: Is the Backtest Meaningful?
The test should represent more than one favorable period.
✓ Meaningful trade sample
✓ Multiple months or market environments
✓ Realistic spread and trading costs
✓ No cherry-picking
✓ Rules remained stable
✓ Out-of-sample validation completed
Readiness Check #3: Do the Statistics Support the Strategy?
Expectancy: Positive across meaningful sample
Profit Factor: Above 1 after realistic costs
Maximum Drawdown: Acceptable
Losing Streak: Understood
Trade Frequency: Practical
Outlier Dependence: Acceptable
Readiness Check #4: Does Forward Testing Support the Backtest?
Exact matching is not required.
| Metric |
Backtest |
Forward Test |
| Win Rate |
48% |
46% |
| Expectancy |
+0.54R |
+0.37R |
| Avg Winner |
+2.2R |
+2.0R |
| Max Loss Streak |
7 |
5 |
The forward test supports the general historical profile rather than contradicting it.
Readiness Check #5: Can You Actually Follow It?
A strong strategy with poor execution can still produce poor results.
Rule compliance consistently high
Few impulsive entries
Stops remain unchanged emotionally
Targets follow plan
No revenge trading after losses
Risk remains consistent after wins
“Live” Does Not Mean “Full Risk”
The first live stage should still be treated as validation.
Small Live Risk = Psychology Test
You are testing what happens when the exact same system is exposed to real financial consequences.
Why Start Smaller Than Your Final Intended Risk?
Real losses feel different.
Real winners can create overconfidence.
Execution mistakes may increase under pressure.
You may discover new psychological weaknesses.
Lower initial risk reduces the cost of those discoveries.
Example Live-Risk Transition
Example Only
Backtesting: Risk measured in R
Demo: Simulated 0.5% risk
Initial Live Stage: 0.10%–0.25%
Validated Live Stage: Potentially increase gradually
Maximum Planned Risk: Defined in advance by the trader’s risk plan
These percentages are educational examples, not recommendations. Appropriate risk depends on the trader, instrument, account structure and financial circumstances.
Define Scaling Rules Before You Start
Do not increase risk simply because you feel good after a winning streak.
Example Process Rule
“Risk may increase only after 30 properly executed live trades, rule compliance remains above 95%, drawdown remains inside expected limits and no unresolved execution problems exist.”
Do Not Scale Based Only on Profit
Five winning trades.
Account is up.
Trader triples risk.
Profit does not prove the process is stable.
Scale Based on Process Milestones
Minimum live trade sample completed
Rule compliance remains high
Execution gap remains small
Drawdown remains inside expectations
No revenge or overconfidence problems
Scaling schedule was defined beforehand
Keep Risk Streak-Neutral
Emotional Risk
Increase size after wins and chase losses with larger positions.
Systematic Risk
Risk changes only when predefined process criteria are met.
Continue Collecting Data After Going Live
Going live does not end the testing process.
Live win rate
Live expectancy
Average winner
Average loser
Maximum drawdown
Rule compliance
Execution gap
Slippage
Missed trades
Compare Live Results With the Expected Range
A strategy does not need to reproduce its historical numbers exactly.
| Metric |
Historical |
Live |
Concern? |
| Win Rate |
48% |
45% |
Probably Normal |
| Expectancy |
+0.54R |
+0.31R |
Monitor |
| Drawdown |
-11R Max |
-8R |
Inside Historical Range |
What Is Performance Drift?
Performance drift means live results begin moving materially away from the behavior observed during testing.
Historical expectancy: +0.50R
First 50 live trades: +0.38R
Next 50 live trades: +0.09R
Next 50 live trades: -0.12R
That pattern deserves investigation.
What Can Cause Performance Drift?
Normal statistical variance
Different market regime
Higher spreads or costs
Execution degradation
Rule changes
Psychological mistakes
Underlying strategy edge weakening
Diagnose Before You Change the Strategy
Question 1: Were the rules followed?
Question 2: Did execution differ from the test?
Question 3: Is the sample large enough?
Question 4: Has the market regime changed?
Question 5: Is the edge actually deteriorating?
Define a Strategy Pause Rule
Do not wait until fear decides when to stop.
Example Review Trigger:
Pause the strategy if live drawdown exceeds 1.5 times the historical maximum drawdown or if rolling expectancy becomes materially negative over a predefined trade sample.
The exact criteria should be tailored to the strategy and defined before problems occur.
Pause vs. Reduce Risk
Not every concern requires immediately shutting the strategy down.
Reduce Risk
Results are weaker but still inside a plausible historical range.
Pause
Performance materially breaks expected limits or execution has become unreliable.
Going Back to Testing Is Not Failure
Professional strategy development is a cycle: test, deploy, measure, review and retest when necessary.
Build → Test → Validate → Trade → Measure → Review → Improve
Treat Major Changes as a New Strategy Version
Version 1.0: Original live strategy
Problem: Entry slippage materially reduces expectancy
Change: New entry method
Version 1.1: Revised strategy
Next Step: Backtest and forward test Version 1.1 before full deployment
Do Not Optimize Every Losing Trade
Trade loses.
New filter added.
Next trade loses.
Target changed.
Free Academy Access
Unlock the rest of this lesson free
Sign in to continue, or create a 100% free Academy account and unlock the full member experience.
ALREADY A MEMBER?
Sign In & Continue
Access the rest of this lesson instantly.
Forgot password?

 13 min
 12 min
 13 min