Module 7 · Building & Testing a Complete Trading Strategy · Lesson 1
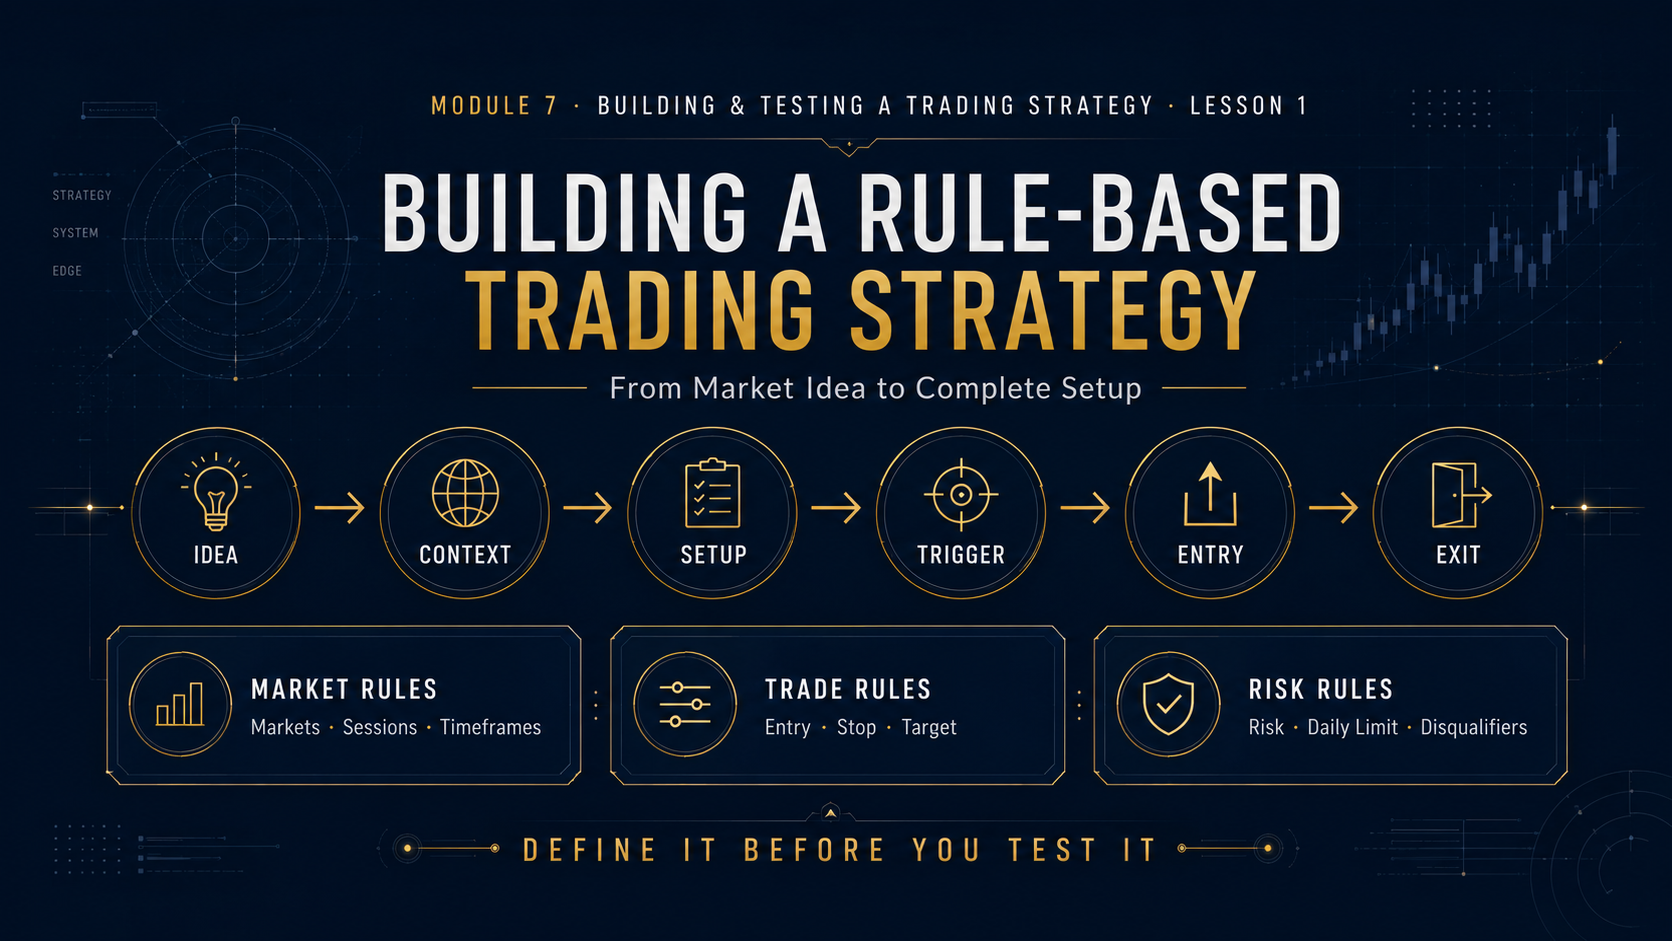
Building a Rule-Based Trading Strategy: From Market Idea to Complete Setup
Learn how to turn a trading idea into a complete rule-based strategy with defined markets, sessions, setup conditions, entry triggers, stops, targets, risk rules and invalidation criteria that can actually be tested.
Trading Strategy
Entry Rules
Risk Rules
Strategy Blueprint
“Buy support.”
“Trade with the trend.”
“Wait for confirmation.”
These ideas sound reasonable, but they are not complete trading strategies.
A strategy must answer exactly what qualifies, what does not qualify, when the trade is allowed, how the position is entered, where it becomes invalid, how much is risked and how the trade is exited.
If two traders reading the same strategy rules can make completely different decisions, the strategy probably is not specific enough yet.
Module 7 will show you how to convert trading concepts into measurable rules and then test whether those rules actually produce a repeatable edge.
Lesson Objectives
What You’ll Learn
✓ What makes a strategy testable
✓ How to define market conditions
✓ How to write exact entry rules
✓ How to define stops and targets
✓ How to build risk rules
✓ How to create a complete strategy blueprint
What Is a Trading Strategy?
A trading strategy is a predefined set of rules that determines when a market opportunity qualifies for a trade and how that trade should be managed.
Market Conditions → Setup → Trigger → Entry → Stop → Target → Risk → Exit
Every one of those components should be defined before the strategy is evaluated.
Trading Idea vs. Trading Strategy
Trading Idea
“Buy pullbacks during an uptrend.”
Trading Strategy
“Buy only when the 4H structure is bullish, price pulls back into predefined support, the lower timeframe forms bullish confirmation and minimum 2R target space remains.”
A Strategy Must Be Testable
If the rules cannot be applied to historical charts consistently, you cannot properly determine whether the strategy has an edge.
Can you identify exactly when the setup begins?
Can you identify exactly when the trigger occurs?
Can you determine an objective stop?
Can you determine the target before entry?
Can you determine whether the trade should be skipped?
Can another trader apply the same rules consistently?
Start by Defining the Strategy Variables
| Variable |
Question to Answer |
| Market |
What instruments can be traded? |
| Timeframe |
What timeframe defines context and entry? |
| Session |
When can setups be taken? |
| Context |
What market condition must exist? |
| Trigger |
What exact event creates the entry? |
| Stop |
Where is the setup invalid? |
| Target |
Where does profit get taken? |
| Risk |
How much account capital can be lost? |
Step 1: Define the Markets
A strategy should specify which instruments it was designed for.
Too Vague:
“Trade anything that moves.”
Better:
“Strategy is tested only on EUR/USD, GBP/USD and XAU/USD.”
Different markets have different volatility, liquidity, spreads and session behavior.
Step 2: Define the Timeframes
A multi-timeframe strategy should clearly define the role of each chart.
4H: Higher-timeframe market structure.
1H: Key support and resistance.
15-Minute: Entry confirmation.
If you constantly switch timeframes until you find a reason to enter, the timeframe rules are not doing their job.
Step 3: Define the Trading Session
Timing changes liquidity, volatility and setup quality.
Example Rule
“New entries are allowed only during the London open or the first two hours of the New York trading window.”
That rule makes the strategy much easier to test than “trade whenever the chart looks good.”
Step 4: Define the Market Context
Context determines the environment where the setup is allowed to exist.
Trend Strategy
Trade only with confirmed higher-timeframe trend.
Range Strategy
Trade only between clearly defined boundaries.
Breakout Strategy
Trade only after compression and confirmed expansion.
Define What “Trend” Means
Even common words need rules.
Too Vague:
“The market should look bullish.”
Rule-Based:
“4H must have produced a higher high and higher low, and the most recent confirmed structural break must be bullish.”
Step 5: Define the Setup Location
A strong trigger in a poor location may still be a poor trade.
Possible Locations:
Higher-timeframe support
Higher-timeframe resistance
Previous breakout level
Liquidity sweep area
Session high or low
Step 6: Define the Exact Entry Trigger
This is where “wait for confirmation” becomes an actual rule.
Vague:
“Enter when buyers look strong.”
Testable:
“After price sweeps support, enter only after a 15-minute bullish candle closes above the high of the previous bearish candle and minor bearish structure breaks.”
Decide Whether Candle Close Is Required
If the strategy requires confirmation at candle close, then intrabar movement does not count.
A Trigger Is Either Complete or It Is Not.
Step 7: Define the Entry Method
Market Entry: Enter immediately after confirmation.
Retest Entry: Wait for price to revisit the breakout area.
Limit Entry: Place predefined order at a qualifying level.
Different entry methods can produce different win rates, stop distances and missed-trade rates, so do not mix them casually during testing.
Step 8: Define the Stop-Loss Rule
The stop should identify where the trading idea becomes invalid.
Bullish Setup: Stop below structural swing low.
Bearish Setup: Stop above structural swing high.
Rule: Stop distance determines position size — not account risk.
“Put the stop somewhere safe” cannot be reliably backtested.
Step 9: Define the Profit Target
Your exit method affects the entire strategy.
Fixed R Target
Example: 2R every trade.
Structural Target
Exit at opposing support/resistance.
Trailing Exit
Follow market structure as trade develops.
Choose the exit rule before testing so you are not selecting whichever outcome makes historical trades look best afterward.
Step 10: Define Minimum Risk-to-Reward
Example Rule
“No trade may be entered unless at least 2R of realistic target space exists before major opposing structure.”
Step 11: Define Risk Per Trade
Testing becomes much more useful when trade outcomes are measured in R-multiples rather than random lot sizes.
1R: Amount intentionally risked on the trade.
Loss: -1R
2:1 Winner: +2R
Breakeven: 0R
Position size should adapt to the stop distance so the account risk remains consistent.
Step 12: Define Session and Daily Risk Rules
Maximum trades per session
Maximum daily loss
Maximum simultaneous positions
Maximum correlated exposure
Rules after consecutive losses
Step 13: Define the News Filter
Do not leave economic-news handling undefined.
Example:
“No new position may be opened within 15 minutes before or after a high-impact event directly affecting the instrument.”
Step 14: Define Automatic Disqualifiers
A good strategy explains when not to trade just as clearly as when to trade.
✕ Outside approved trading session
✕ Major news too close
✕ Higher timeframe contradicts setup
✕ Entry candle already excessively extended
✕ Insufficient target space
✕ Daily loss limit reached
✕ Required confirmation did not occur
Keep the First Version Simple
Traders often believe more rules automatically create a better strategy.
More Indicators ≠ More Edge
Every additional rule reduces the number of setups and increases the number of variables you must understand.
Start with the simplest version that clearly expresses the trading idea. Add complexity only when data shows it improves the strategy.
Every Indicator Must Have a Job
If your strategy uses an indicator, define exactly why.
Moving Average: Trend filter?
ATR: Volatility filter or stop calculation?
RSI: Momentum condition?
Volume: Confirmation of participation?
Avoid adding indicators simply because they make the chart feel more sophisticated.
Can a Strategy Include Discretion?
Yes — but discretionary elements should still be clearly described.
Unstructured Discretion
“I enter when the chart feels right.”
Defined Discretion
“I may reject a valid setup if price is directly beneath major daily resistance.”
Give the Setup a Name
Naming setups helps with journaling and testing.
London Sweep Reversal
Break-and-Retest Continuation
New York Opening Pullback
Higher-Timeframe Support Reversal
Later, you can measure which setup performs best instead of treating every trade as the same.
A-Setups vs. B-Setups
If you classify setup quality, define the difference before collecting results.
A-Setup
Higher-timeframe alignment
Key location
Liquidity event
Full confirmation
Minimum 2R available
B-Setup
Valid core setup
One preferred confluence missing
Still meets minimum strategy requirements
Example Complete Strategy Blueprint
Example · London Pullback Continuation
Markets: EUR/USD and GBP/USD
Higher Timeframe: 4H
Entry Timeframe: 15-minute
Session: London open only
Trend Rule: 4H must show confirmed HH/HL structure for longs or LL/LH for shorts
Location: Pullback to broken support/resistance or key session level
Trigger: 15-minute confirmation close plus minor BOS
Entry: Market at confirmation close
Stop: Beyond the confirmation swing
Target: Fixed 2R
Risk: 0.5% per trade
News Rule: No trade within 15 minutes of major relevant news
Daily Limit: Maximum two trades
Rules Prevent the Same Chart From Becoming Five Different Trades
Without rules: enter early.
Stop gets moved.
Free Academy Access
Unlock the rest of this lesson free
Sign in to continue, or create a 100% free Academy account and unlock the full member experience.
ALREADY A MEMBER?
Sign In & Continue
Access the rest of this lesson instantly.
Forgot password?

 12 min
 13 min
 13 min