Module 7 · Building & Testing a Complete Trading Strategy · Lesson 3
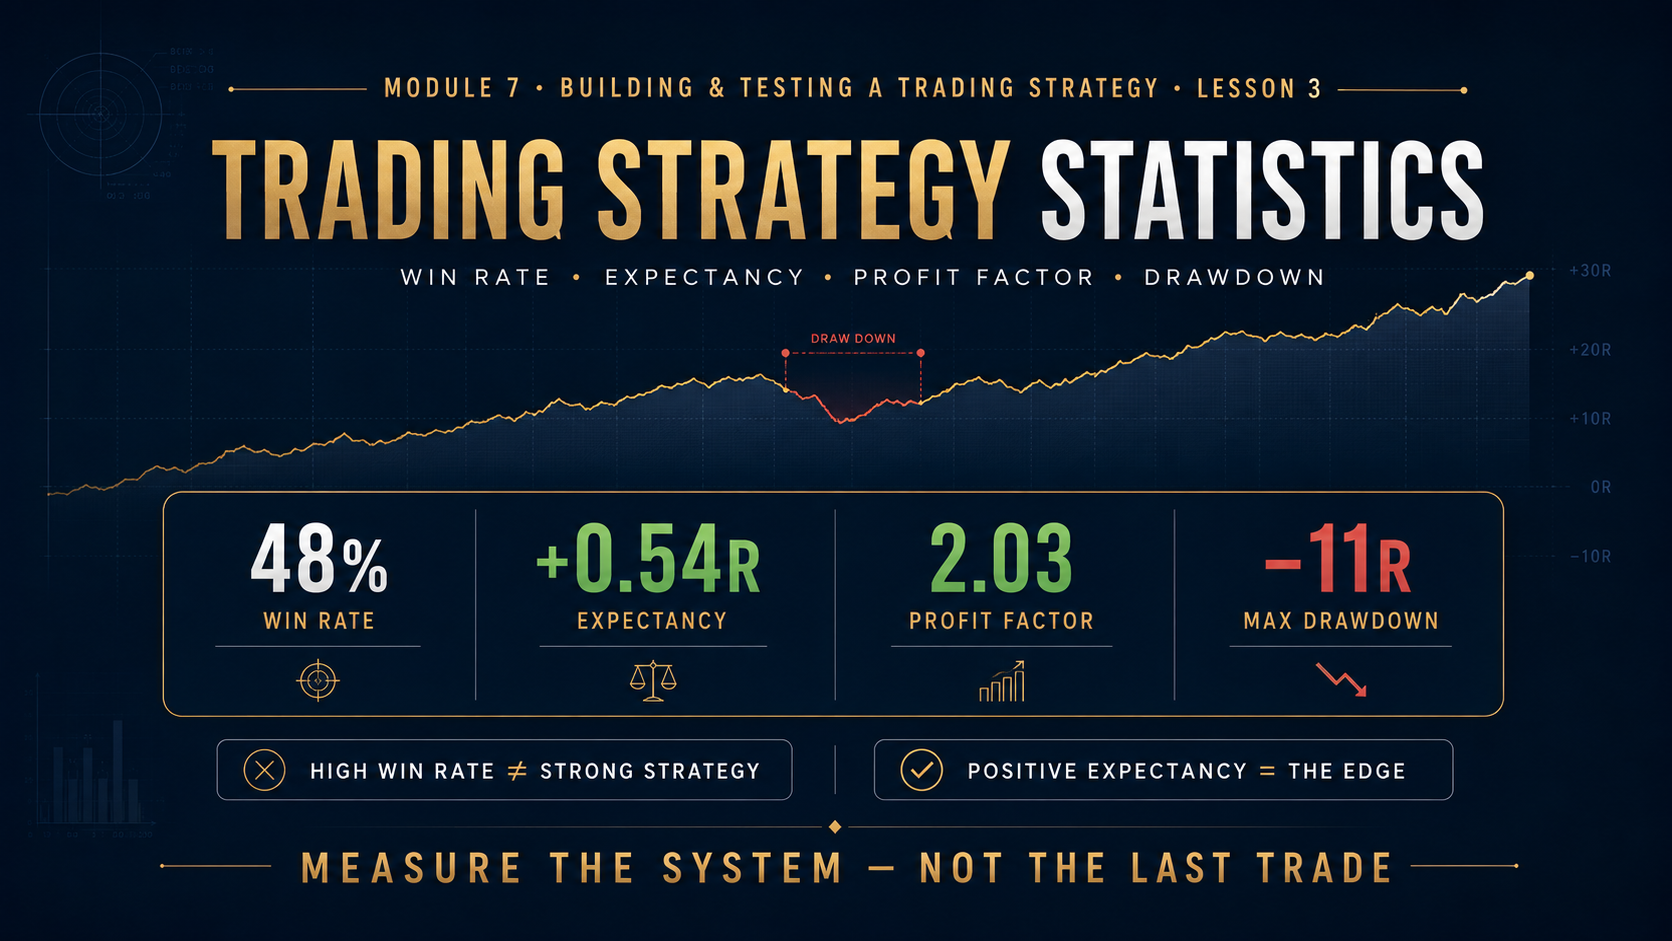
Trading Strategy Statistics: Win Rate, Expectancy, Profit Factor & Drawdown
Learn how to measure the performance of a trading strategy using win rate, average winner, average loser, expectancy, profit factor, drawdown, losing streaks and other statistics that reveal whether a strategy actually has an edge.
Win Rate
Expectancy
Profit Factor
Drawdown
A 75% win rate sounds impressive.
But what if the average winner makes 0.5R and the average loser loses 3R?
A 40% win rate sounds weak.
But what if the average winner makes 3R while the average loser loses only 1R?
No single statistic tells you whether a trading strategy is good. The numbers must be interpreted together.
In this lesson, we take the backtest data from Lesson 2 and turn it into meaningful performance statistics.
Lesson Objectives
What You’ll Learn
✓ How to calculate win rate
✓ Why win rate alone can mislead
✓ How expectancy measures edge
✓ What profit factor reveals
✓ How to analyze drawdown
✓ How to compare strategy quality objectively
Why Trading Statistics Matter
Traders naturally remember dramatic wins and painful losses.
Statistics prevent those memorable trades from controlling your judgment.
Individual Trade → Emotion
Large Sample → Evidence
A strategy should be evaluated across a meaningful sample rather than by the outcome of the last few trades.
The Core Strategy Statistics
Win Rate
How often trades win.
Average Winner
Average profit on winning trades.
Average Loser
Average loss on losing trades.
Expectancy
Expected average result per trade.
Profit Factor
Gross profit versus gross loss.
Drawdown
Decline from peak equity.
Statistic #1: Win Rate
Win rate measures the percentage of trades that finish as winners.
Win Rate = Winning Trades ÷ Total Trades × 100
Winning trades: 54
Total trades: 100
Win Rate = 54%
The Win-Rate Trap
Traders often assume a higher win rate automatically means a better strategy.
It does not.
| Strategy |
Win Rate |
Avg Winner |
Avg Loser |
| Strategy A |
75% |
+0.5R |
-2R |
| Strategy B |
40% |
+3R |
-1R |
Win rate tells you how often you win. It does not tell you how much you win when you are right or how much you lose when you are wrong.
Loss Rate
If you exclude breakeven trades, loss rate can often be calculated as:
Loss Rate = 100% − Win Rate
Win rate = 54%
Loss rate = 46%
Statistic #2: Average Winner
Average winner measures the average size of all profitable trades.
Average Winner = Total R From Winning Trades ÷ Number of Winners
Total winning R: 108R
Winning trades: 54
Average winner = +2R
Statistic #3: Average Loser
Average loser measures the average size of losing trades.
Total losing R: -46R
Losing trades: 46
Average loser = -1R
Statistic #4: Payoff Ratio
The payoff ratio compares the average winning trade with the average losing trade.
Payoff Ratio = Average Winner ÷ Average Loser
Average winner = 2R
Average loser = 1R
Payoff ratio = 2.0
Statistic #5: Expectancy
Expectancy is one of the most important statistics in strategy analysis.
It estimates the average amount a strategy earns or loses per trade over a large sample.
Expectancy = (Win Rate × Average Win) − (Loss Rate × Average Loss)
Win rate: 54%
Average winner: 2R
Loss rate: 46%
Average loser: 1R
0.54 × 2 = 1.08
0.46 × 1 = 0.46
Expectancy = +0.62R per trade
What Does +0.62R Expectancy Mean?
It does not mean every trade earns 0.62R.
Individual trades may lose 1R, win 2R or finish near breakeven.
Expectancy describes the average edge across many trades — not the outcome of the next trade.
Negative Expectancy
If expectancy is consistently negative over a meaningful and properly tested sample, the strategy is losing value on average rather than creating it.
Break-Even Win Rate
Break-even win rate tells you approximately how often a strategy must win to avoid losing money given a fixed reward-to-risk relationship.
| Reward : Risk |
Approx. Break-Even Win Rate |
| 1 : 1 |
50% |
| 1 : 1.5 |
40% |
| 1 : 2 |
33.3% |
| 1 : 3 |
25% |
This helps explain why a lower-win-rate strategy can still be profitable when winners are substantially larger than losers.
Statistic #6: Profit Factor
Profit factor compares the total amount won with the total amount lost.
Profit Factor = Gross Profit ÷ Absolute Gross Loss
Gross winning trades = 108R
Gross losing trades = 46R
Profit factor = 2.35
Interpreting Profit Factor
| Profit Factor |
General Interpretation |
| Below 1.0 |
Gross losses exceed gross profits |
| 1.0 |
Approximately break-even before costs |
| Above 1.0 |
Gross profits exceed gross losses |
| Higher Values |
Potentially stronger historical efficiency, but sample size and robustness still matter |
Statistic #7: Net R
Net R adds the result of every trade together.
Net R = Total Winning R − Total Losing R
Total winning R = +108R
Total losing R = -46R
Net result = +62R
Statistic #8: Average R Per Trade
Average R Per Trade = Net R ÷ Total Trades
Net R = 62R
Trades = 100
Average = +0.62R per trade
With simple win/loss outcomes, this should align with the expectancy calculation.
Statistic #9: Maximum Drawdown
Maximum drawdown measures the largest decline from a previous equity peak to a later trough during the test.
Equity peak: +26R
Later trough: +17R
Drawdown = -9R
Why Maximum Drawdown Matters
Two strategies can produce the same total profit but require very different emotional and financial tolerance.
Strategy A
Net: +40R
Max drawdown: -6R
Strategy B
Net: +40R
Max drawdown: -22R
Same historical profit. Very different risk journey.
Drawdown in Percentage Terms
If your risk is fixed as a percentage of the account, an R-based drawdown can be translated approximately into account risk.
Risk per trade = 0.5%
Historical max drawdown = -10R
Approximate simple drawdown = -5% before compounding effects.
Statistic #10: Maximum Losing Streak
Maximum losing streak measures the largest number of consecutive losing trades in the sample.
L · L · L · L · L · L · W
Maximum Losing Streak = 6
A strategy can be profitable and still contain uncomfortable losing streaks.
Maximum Winning Streak
Winning streaks matter too because they can influence psychology and create unrealistic expectations.
Maximum historical winning streak: 8 trades
Eight consecutive winners do not mean the ninth trade becomes safer.
Statistic #11: Equity Curve
An equity curve plots cumulative strategy results in chronological order.
0R → +2R → +1R → +3R → +2R → +1R → +3R → +5R
The shape of the curve can reveal periods of strong performance, stagnation and drawdown.
Do Not Expect a Perfectly Smooth Equity Curve
A historical curve that moves upward with almost no meaningful drawdown may deserve extra scrutiny. It can sometimes indicate overfitting, unrealistic assumptions or an unusually favorable sample.
Statistic #12: Recovery Factor
Recovery factor compares total return with maximum drawdown.
Recovery Factor = Net Profit ÷ Maximum Drawdown
Net performance = +40R
Maximum drawdown = 8R
Recovery factor = 5.0
Statistic #13: Trade Frequency
Trade frequency affects how quickly a strategy can build a meaningful sample and how practical it is for the trader.
Average trades per week
Average trades per month
Longest period without a setup
Average time held per position
A strategy that averages three trades per month may require much more patience than one averaging three trades per day.
Statistic #14: Average Trade Duration
Duration matters because it affects execution style, overnight exposure and the trader’s lifestyle.
Intraday Strategy
Average hold: 40 minutes
Swing Strategy
Average hold: 2.5 days
Segment the Data
Overall results can hide important differences.
Performance by market
Performance by session
Performance by setup type
Long vs. short trades
Trend vs. range conditions
High-volatility vs. low-volatility periods
Example: Same Strategy, Different Sessions
| Session |
Trades |
Win Rate |
Expectancy |
Net R |
| London |
70 |
57% |
+0.64R |
+44.8R |
| New York |
68 |
43% |
+0.11R |
+7.5R |
Both may be historically profitable, but one session appears substantially stronger.
Example: High Win Rate, Poor Strategy
Win rate: 80%
Average winner: +0.25R
Average loser: -2R
Expected win contribution: 0.80 × 0.25 = 0.20R
Expected loss contribution: 0.20 × 2 = 0.40R
Expectancy = -0.20R
The strategy wins often but loses more on average than its winners can recover.
Example: Low Win Rate, Positive Strategy
Win rate: 35%
Average winner: +3R
Average loser: -1R
Expected win contribution: 0.35 × 3 = 1.05R
Expected loss contribution: 0.65 × 1 = 0.65R
Expectancy = +0.40R
Strategy Statistics Must Fit the Trader Too
A mathematically profitable strategy may still be difficult for a particular trader to execute.
Low Win Rate / Large Winners
Can require tolerating long losing streaks and waiting patiently for larger winners.
Higher Win Rate / Smaller Winners
May feel psychologically easier but can be vulnerable if occasional losses are too large.
Sample Size Changes How Much You Can Trust the Statistics
10 trades with 70% win rate = weak evidence.
100 trades with 57% win rate = more informative.
Precision improves as the sample becomes more representative.
Look for Robustness, Not Perfection
A strategy is more interesting when positive behavior survives across different periods and reasonable variations.

 13 min
 13 min
 11 min