Liquidity, Stop Hunts & False Breakouts: Why Price Sweeps Highs and Lows
Learn why price frequently runs above previous highs or below previous lows, where liquidity builds, how false breakouts trap traders, and how to distinguish a genuine structure break from a sweep.
Have you ever watched price break above an obvious high, entered the breakout, and then seen the market immediately reverse?
Or watched price drop below a major low, trigger what looked like a bearish breakout, and then rally violently in the opposite direction?
That behavior is one of the reasons traders study liquidity.
This does not mean every breakout is manipulation or every wick is a stop hunt. The goal is to understand why certain areas attract activity and how to read the reaction that follows.
What You’ll Learn
What Is Liquidity in Trading?
Liquidity describes the availability of buyers and sellers in a market.
A highly liquid market can generally absorb larger orders more efficiently than a thin market with fewer participants.
Traders also use the word liquidity more informally to describe areas where a large concentration of orders may be sitting.
Where Does Liquidity Often Build?
Certain chart locations are naturally more obvious to traders than others.
Common Liquidity Areas
These areas matter because many traders can see them and may place similar orders around them.
Buy-Side vs. Sell-Side Liquidity
Traders often describe liquidity above highs and below lows using two simple terms.
Above Previous Highs
This area can contain stop losses from short positions and breakout buy orders waiting above resistance or swing highs.
Below Previous Lows
This area can contain stop losses from long positions and breakout sell orders waiting below support or swing lows.
Why Do Stop Losses Cluster Around Highs and Lows?
Imagine a trader sells near resistance.
Where is the obvious place to put the stop?
Now imagine hundreds or thousands of traders see the same chart and make a similar decision.
A cluster of orders can form above that high.
What Is a Stop Hunt?
“Stop hunt” is a popular trading term used to describe price moving through an obvious level, triggering clustered stop orders, and then reversing.
You may also hear traders call this a liquidity sweep, liquidity grab or stop run.
A Stop Hunt Is Not Necessarily Someone Targeting Your Trade
This concept is often explained badly.
Beginners sometimes imagine that a broker or institution looked at their specific stop loss and deliberately moved price to take it.
That is generally not a useful way to think about market behavior.
Focus on observable price behavior rather than conspiracy explanations.
What Is a False Breakout?
A false breakout occurs when price moves beyond support, resistance or structure but fails to sustain the move.
Why False Breakouts Can Move Fast
False breakouts can create trapped traders.
Imagine traders buy the breakout above resistance.
Price immediately falls back below the level.
Their sell orders add pressure.
New selling adds pressure.
The reversal can accelerate.
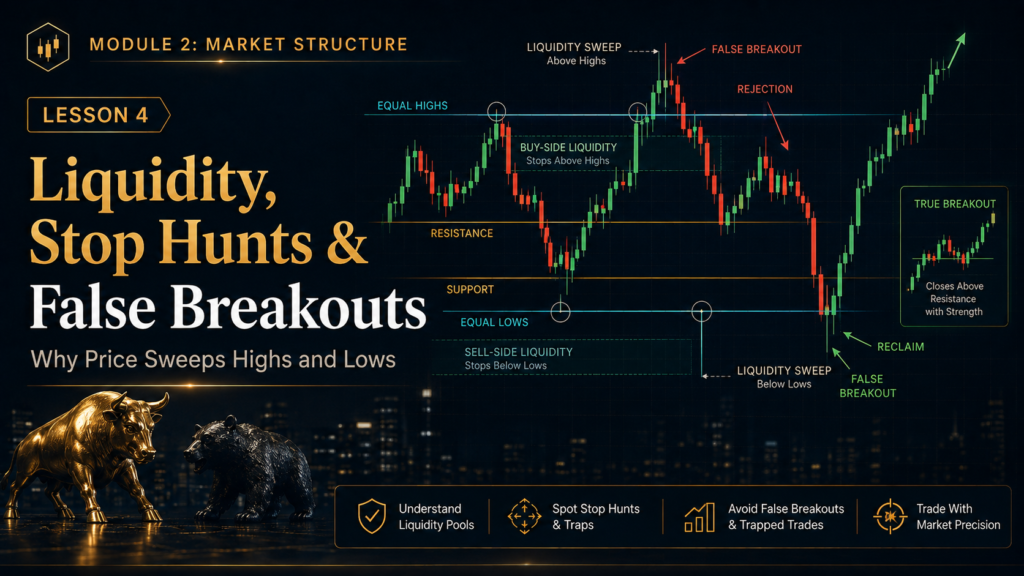
Liquidity Sweep Above a High
A common bearish sweep occurs above a previous high.
Liquidity Sweep Below a Low
The opposite pattern can occur below a previous low.
Why Equal Highs Attract Attention
Equal or nearly equal highs are visually obvious.
That means many traders can see the same resistance area.
This does not guarantee a sweep. It simply means the area may contain meaningful order flow.
Why Equal Lows Attract Attention
Equal lows create a similarly obvious support area.
Liquidity Sweep vs. Genuine Breakout
This distinction is crucial.
| Characteristic | Liquidity Sweep | Genuine Breakout |
|---|---|---|
| Level Break | Temporary | Sustained |
| Candle Close | Often back inside | Often beyond the level |
| Follow-Through | Weak or reversed | Continues in breakout direction |
| Retest | Often fails | Broken level may hold in new role |
Candle Close Is One of Your Best Clues
A wick tells you price explored beyond the level.
A close tells you whether the market accepted that new price area.
Price trades above resistance but closes back below it.
Price closes strongly beyond resistance and holds above it.
Context Matters More Than the Wick
A long wick by itself is not enough information.
The meaning of the sweep depends on where it happens and what the larger market is doing.
Useful Context Includes:
Bullish Liquidity Sweep Example
Imagine EUR/USD is broadly bullish but is currently pulling back.
The sweep becomes useful because it aligns with broader bullish context and is followed by evidence that buyers regained control.
Bearish Liquidity Sweep Example
Do Not Trade Every Sweep
This is where traders can become overly aggressive.
They learn about liquidity and suddenly every wick becomes a setup.
Wait for the sweep to fit the larger market story.
What Makes a Sweep More Meaningful?
Why News Can Create Violent Liquidity Sweeps
Major economic releases can create sudden bursts of volatility.
Price may rapidly move through both sides of a recent range before choosing direction.
Always know whether major scheduled news is approaching before interpreting a sudden sweep as a normal technical setup.
Session Highs and Lows Can Attract Liquidity
Traders often monitor obvious session extremes such as:
These levels are visible to many market participants, which can make them important areas to watch.
Liquidity Around a Trading Range
A range naturally creates two obvious pools of interest.
Buy stops, short stops and breakout buyers may be positioned here.
Sell stops, long stops and breakout sellers may be positioned here.
This is why a range can temporarily break one side before reversing toward the other.
Liquidity Sweep + Change of Character
One useful combination is a liquidity sweep followed by a structural shift.
Each additional piece helps move the idea from “interesting wick” toward a structured trade setup.
Liquidity Should Change How You Think About Stop Placement
If an obvious high contains liquidity, placing a stop one tiny fraction above that exact high can make the stop vulnerable to ordinary market noise.
That does not mean stops should be made unnecessarily wide.
It means the stop should sit where the trade idea is genuinely invalid — not merely where everyone else can see the exact same obvious level.
If You Trade Breakouts, Wait for Proof
Breakout trading becomes dangerous when the only reason for entry is:
Stronger breakout evidence may include:
Common Liquidity & False Breakout Mistakes
A wick is just a wick until context gives it meaning.
Liquidity concepts describe possibilities, not guaranteed price paths.
Price can continue far beyond the obvious level before reversing, or never reverse at all.
A market that closes beyond a level behaves differently from one that immediately rejects it.
A sweep against major structure may carry different implications from one aligned with it.
Focus on execution, risk and observable market behavior instead of trying to explain every loss as intentional targeting.
Liquidity Analysis Framework
Learn Why Breakouts Fail — and What Price Is Telling You After the Sweep
Financial Markets Academy offers live 1-on-1 mentorship for traders who want help reading liquidity, market structure, support and resistance, false breakouts and confirmation in real market conditions.
Reserve Your Seat →Liquidity & False Breakout Checklist
Frequently Asked Questions
What is liquidity in trading?
Liquidity broadly refers to the availability of buyers and sellers. Traders also use the term to describe areas where clusters of orders may exist, such as above highs or below lows.
What is a liquidity sweep?
A liquidity sweep occurs when price trades through an obvious high or low, triggers orders around the level and then fails to continue in the breakout direction.
What is a stop hunt?
Stop hunt is a popular term for price moving through an obvious area where many stop-loss orders may be clustered. It should not automatically be interpreted as someone deliberately targeting one trader.
How can I tell a false breakout from a real breakout?
No method is perfect, but candle closes, follow-through, retests, momentum and higher-timeframe context can help distinguish a temporary sweep from a sustained breakout.
Why do equal highs and equal lows matter?
They are obvious chart levels where stop losses and breakout orders may cluster, making them useful areas to monitor for reactions.
Should I enter immediately after a liquidity sweep?
Not necessarily. A sweep provides context, but confirmation such as rejection, structure shift or a retest can help create a more complete trade setup.
Module 2 · Lesson 4 Knowledge Quiz
B. Only below lows
C. Inside indicators
D. At random prices
B. Below previous lows
C. Inside moving averages
D. At market open only
B. Every breakout
C. A broker error
D. A profitable trade
B. No
C. Only on Forex
D. Only during London
B. Maximum leverage
C. Guessing the reversal
D. Entering before the candle closes
Key Takeaways
Lesson 5: Multi-Timeframe Analysis
You now understand trends, key levels, structure breaks and liquidity. The final lesson in Module 2 shows you how to combine multiple timeframes so you can separate the larger market direction from short-term price noise.