Market Structure Explained: How to Read Trends, Ranges, Higher Highs & Lower Lows
Learn how to identify bullish, bearish and ranging markets using higher highs, higher lows, lower highs and lower lows — the foundation of reading price action properly.
Before you learn advanced entries, indicators or complicated strategies, you need to answer one basic question:
Is price trending higher? Trending lower? Moving sideways? Has momentum changed? Has a previous high been broken? Has a previous low failed?
These questions form the foundation of market structure.
If you can learn to read structure clearly, charts start becoming much easier to understand because you are no longer reacting to every candle. You are reading the larger story created by price.
What You’ll Learn
What Is Market Structure?
Market structure describes the pattern created by price as it moves through highs and lows.
Every chart constantly creates swing points. Price pushes in one direction, pauses or reverses, then makes another push.
Those swing points help traders determine whether buyers, sellers or neither side currently has clear control.
The Three Basic Market Conditions
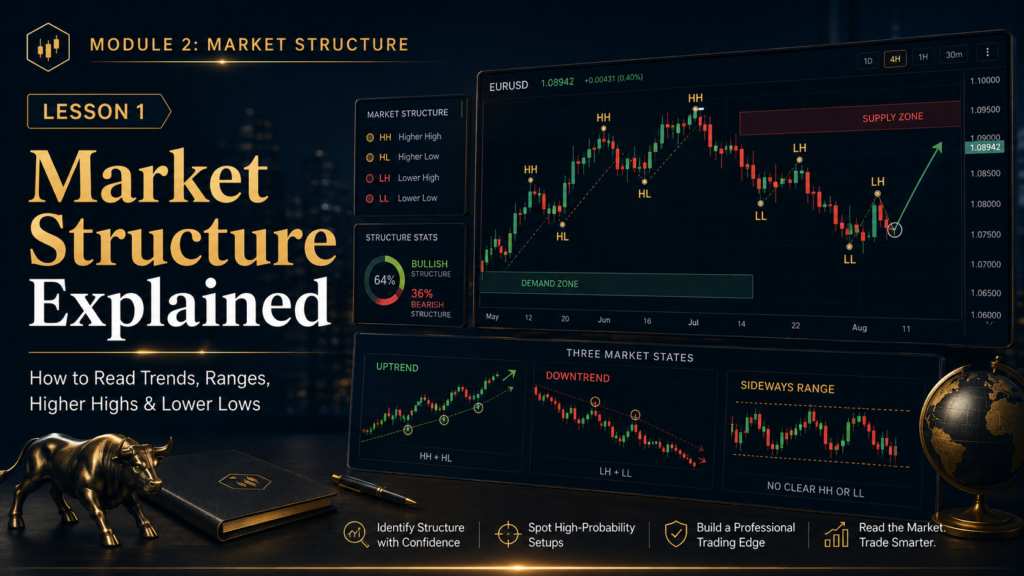
Most price action can be broadly classified into three conditions.
Uptrend
Price is generally producing higher highs and higher lows.
Downtrend
Price is generally producing lower highs and lower lows.
Range
Price moves between support and resistance without sustained directional control.
What Are Swing Highs and Swing Lows?
A swing high is an area where price moved upward, stalled and then moved lower.
A swing low is an area where price moved downward, stalled and then moved higher.
A local peak where buying pressure loses control and price reacts lower.
A local trough where selling pressure loses control and price reacts higher.
The relationship between these swing highs and lows is what creates market structure.
How to Identify an Uptrend
A healthy bullish market structure usually creates:
A higher high means buyers pushed price above the previous important high.
A higher low means the following pullback stopped above the previous important low.
Together, these tell you that buyers are repeatedly pushing the market higher while sellers are failing to reverse the broader direction.
Simple Bullish Structure Example
| Swing | Price | Structure |
|---|---|---|
| Low 1 | 1.0800 | Starting low |
| High 1 | 1.0900 | Swing high |
| Low 2 | 1.0850 | Higher Low |
| High 2 | 1.0950 | Higher High |
Pullbacks Do Not Automatically Mean the Trend Is Over
One of the biggest beginner mistakes is assuming that every bearish candle inside an uptrend means the market has reversed.
Trends do not usually move in a straight line.
Markets expand, pull back, consolidate and then attempt to continue.
How to Identify a Downtrend
Bearish market structure generally creates the opposite sequence:
A lower low means sellers pushed price below the previous important low.
A lower high means buyers attempted to recover but failed below the previous important high.
This repeated failure by buyers helps confirm that sellers remain in control.
Simple Bearish Structure Example
| Swing | Price | Structure |
|---|---|---|
| High 1 | 1.1000 | Starting high |
| Low 1 | 1.0900 | Swing low |
| High 2 | 1.0950 | Lower High |
| Low 2 | 1.0850 | Lower Low |
How to Identify a Ranging Market
Not every market trends.
Sometimes price repeatedly moves between a defined upper boundary and lower boundary.
Buyers defend the lower boundary while sellers defend the upper boundary, preventing sustained directional movement.
Ranging markets can produce repeated false breakouts because price temporarily moves outside the boundary and then returns inside.
A strategy designed for strong trends may perform poorly inside a range.
Why Market Condition Matters Before Entry
A trade setup does not exist in isolation.
Pullback entries may work well when they align with the dominant structure.
The same entry signal may fail repeatedly because there is no sustained directional movement.
What Exactly Is a Higher High?
A higher high occurs when price pushes above a previous significant swing high.
It suggests buyers were strong enough to overcome the sellers who previously stopped the market at that level.
New Swing High: 1.1050
Result: Higher High
One higher high alone does not guarantee a long-term trend, but it provides useful structural information.
What Is a Higher Low?
After making a higher high, price often pulls back.
If buyers regain control before price reaches the previous significant low, the new swing low may form above it.
New Swing Low: 1.0850
Result: Higher Low
This indicates sellers were unable to push price back to the previous low before buyers stepped in again.
What Is a Lower Low?
A lower low occurs when sellers push price beneath a previous significant swing low.
New Swing Low: 1.0850
Result: Lower Low
This tells you sellers were strong enough to break an area where buyers previously created support.
What Is a Lower High?
After making a lower low, price may recover.
If buyers fail to push back above the previous important high, a lower high may form.
New Swing High: 1.0950
Result: Lower High
Not Every Tiny High or Low Matters
Beginners sometimes label every candle movement as a new higher high or lower low.
That creates noise.
The goal is to read the structure of the market, not label every microscopic fluctuation.
Major Structure vs. Minor Structure
Markets contain smaller swings inside larger swings.
The Larger Story
Significant highs and lows that define the broader direction of the market.
Smaller Movements
Shorter-term swings that occur inside the broader market structure.
A market can therefore look bearish on a five-minute chart while still being bullish on a four-hour chart.
Market Structure Depends on Timeframe
This is one of the most important ideas in technical analysis.
Different timeframes can show different structures at the same moment.
| Timeframe | Possible Structure | Interpretation |
|---|---|---|
| Daily | Bullish | Broad trend higher |
| 1 Hour | Range | Short-term consolidation |
| 5 Minute | Bearish | Small pullback inside larger uptrend |
What Happens When Structure Breaks?
Trends do not last forever.
Eventually, the sequence of higher highs and higher lows — or lower highs and lower lows — can begin to fail.
That failure can provide early information that momentum or directional control is changing.
Example
Market has been creating:
Then price suddenly breaks below the previous important higher low.
We will study breaks of structure, changes of character and potential reversals in more detail later in this module.
Market Structure Is Context — Not Automatically an Entry
Seeing an uptrend does not mean you should immediately press Buy.
Seeing a downtrend does not mean you should immediately press Sell.
Structure provides directional context. You still need a proper location, confirmation, risk calculation and trade plan.
Start Thinking Top-Down
A structured trader often begins with a larger timeframe and gradually works lower.
Practical Example: Reading the Story of Price
Imagine EUR/USD creates the following movements:
What is the story?
The market is showing a clear bullish sequence.
Common Market Structure Mistakes
Structure is based on meaningful swings, not every tiny movement.
A five-minute downtrend can exist inside a daily uptrend.
Pullbacks are a normal part of trending markets.
Sideways markets often produce misleading short-term directional moves.
Structure provides context, not complete entry confirmation.
Larger structural highs and lows often matter more than small intraday noise.
A Simple Market Structure Framework
Stop Looking at Random Candles. Start Reading the Market.
Financial Markets Academy offers live 1-on-1 mentorship for traders who want help identifying structure, understanding market direction, recognizing important swing levels and turning chart analysis into a repeatable trading process.
Reserve Your Seat →Market Structure Checklist
Frequently Asked Questions
What is market structure in trading?
Market structure is the pattern created by significant swing highs and lows. Traders use it to determine whether price is trending upward, downward or moving sideways.
What are higher highs and higher lows?
Higher highs occur when price breaks above previous significant highs, while higher lows occur when pullbacks remain above previous significant lows. Together they commonly indicate bullish structure.
What are lower highs and lower lows?
Lower lows form when sellers push below previous important lows, while lower highs form when buyers fail to recover above previous important highs. Together they commonly indicate bearish structure.
What is a ranging market?
A ranging market moves between an upper resistance area and lower support area without forming a sustained sequence of higher highs or lower lows.
Can different timeframes show different market structure?
Yes. A short-term bearish move can occur inside a larger bullish trend. This is why traders must always define the timeframe being analyzed.
Is market structure enough to enter a trade?
No. Market structure provides context. A complete trade still requires a valid setup, entry confirmation, stop placement, position sizing and risk management.
Module 2 · Lesson 1 Knowledge Quiz
B. Higher highs and higher lows
C. Random candles
D. Flat volume
B. Equal highs only
C. Lower highs and lower lows
D. One bearish candle
B. Any green candle
C. A broker price
D. A stop loss
B. Yes
C. Only in stocks
D. Only during news
B. No, structure is context and you still need a setup
C. Only with maximum leverage
D. Always on gold
Key Takeaways
Lesson 2: Support & Resistance
Now that you can identify the direction and structure of the market, the next step is understanding the price zones where buyers and sellers repeatedly become active.