Support & Resistance Explained: How Key Price Levels Control the Market
Learn how to identify support and resistance, understand why price reacts at important levels, recognize broken levels, and use zones instead of random lines.
Price does not move through a chart randomly.
Certain areas repeatedly attract buyers. Other areas repeatedly attract sellers.
These areas are commonly called support and resistance.
The key is learning how to identify meaningful levels without turning your chart into a mess of horizontal lines.
What You’ll Learn
What Is Support?
Support is an area where buying pressure has previously been strong enough to stop or slow a decline.
As price moves downward into support, buyers may begin entering the market while sellers take profit or reduce positions.
Support does not guarantee that price will rise. It tells you that the area has previously mattered to market participants.
What Is Resistance?
Resistance is an area where selling pressure has previously been strong enough to stop or slow an advance.
As price moves upward into resistance, sellers may enter while buyers take profit.
Why Do Support and Resistance Exist?
Support and resistance exist because traders remember prices.
Market participants make decisions around previous highs, lows, breakout areas and price zones where strong movement previously began.
Why a Level May Matter
Think in Zones, Not Perfect Lines
One of the most common beginner mistakes is expecting support or resistance to work at one exact price.
Real markets are rarely that precise.
Price may overshoot a previous high by several pips, react slightly before a previous low, or briefly break a level before reversing.
What Makes a Support or Resistance Level Strong?
Not every level deserves equal attention.
Characteristics of a More Meaningful Level
A random intraday price that produced a tiny reaction may be much less important than a major daily swing high.
Do More Touches Make a Level Stronger?
Multiple reactions can confirm that a level is being watched.
But there is another side to this.
Every test may consume some of the orders sitting at that level.
Support that has been tested six times is not automatically stronger than support that caused one explosive reaction.
Why Fresh Levels Can Matter
Traders sometimes describe a level as fresh when price has not returned to it since the original reaction.
The idea is that orders may still remain in the area.
Freshness alone is not enough to justify a trade, but it can be useful context when combined with market structure and confirmation.
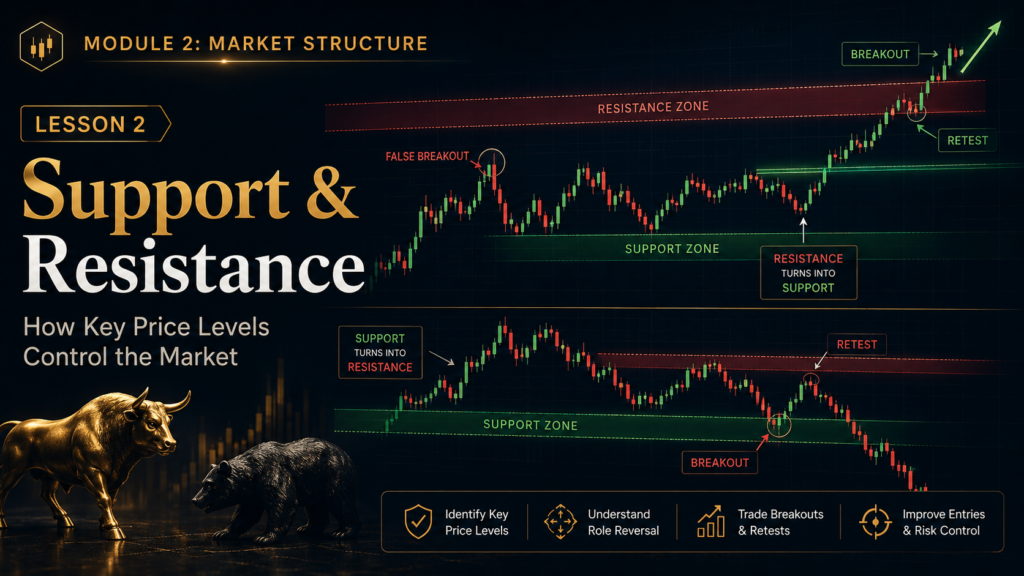
When Resistance Becomes Support
A very important market behavior occurs when resistance is broken and later acts as support.
Why can this happen?
Traders who previously sold at resistance may now be trapped. Traders who missed the breakout may wait for the retest to buy.
The old resistance zone becomes a new decision point.
When Support Becomes Resistance
The opposite can happen in a bearish market.
Traders who bought at the original support may use a return to the level as an opportunity to exit, while sellers may see the retest as a new entry area.
What Is a Breakout?
A breakout occurs when price moves through a significant support or resistance area.
But not every brief movement through a level should be treated as a confirmed breakout.
A Stronger Breakout May Include:
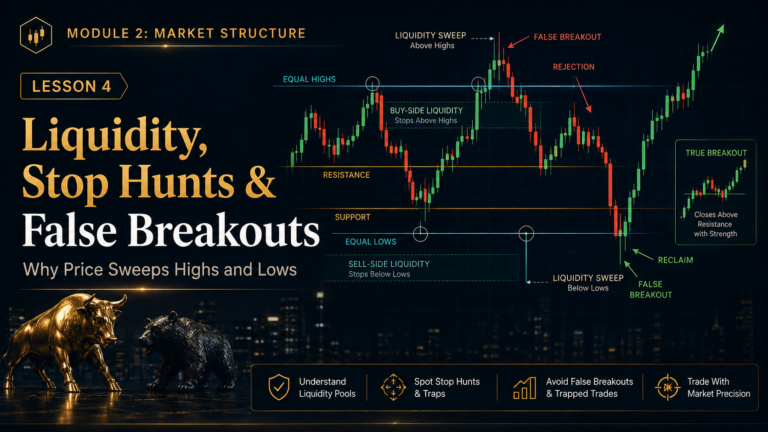
What Is a False Breakout?
A false breakout occurs when price temporarily moves beyond support or resistance but fails to continue.
Price may quickly return back inside the previous range.
Context, candle close, momentum and follow-through matter.
Why Breakout Traders Get Trapped
Imagine resistance sits at 1.1000.
Price suddenly spikes to 1.1015.
Traders see the breakout and buy immediately.
Then price closes back below 1.1000 and begins falling.
Their exits can add additional selling pressure.
Candle Closes Matter
A candle wick tells you price traded somewhere.
The close tells you where the market accepted price when that period ended.
Wick above resistance but candle closes back below.
Strong body closes above resistance and price holds beyond the zone.
Support Inside an Uptrend
Support becomes more meaningful when it aligns with bullish market structure.
Imagine the market is creating higher highs and higher lows.
Price then pulls back into an area where buyers previously stepped in.
Each piece adds context. The support level alone is not the trade.
Resistance Inside a Downtrend
The same logic applies to bearish structure.
Higher-Timeframe Levels Usually Matter More
A support level visible on the daily chart generally represents a larger market event than a tiny level visible only on a one-minute chart.
| Timeframe | Typical Significance | Use |
|---|---|---|
| Daily / 4H | Major | Broad structure and major zones |
| 1H | Intermediate | Refining key levels |
| 5M / 15M | Execution | Fine-tuning entries and confirmation |
Do Round Numbers Matter?
Traders often pay attention to psychologically significant numbers such as:
Round numbers can attract attention because traders naturally think in simple price increments.
But a round number is far more useful when it also aligns with structure, previous reactions or another meaningful technical area.
Static vs. Dynamic Support and Resistance
Horizontal Price Zone
A fixed area such as a previous high, previous low or breakout level.
Moving Reference
A trendline or moving average that changes position as new candles form.
This lesson focuses primarily on horizontal support and resistance because it is foundational and directly tied to market structure.
Do Not Turn Your Chart Into a Barcode
If you mark every price where the market ever paused, eventually your chart will have a line everywhere.
At that point the levels stop helping you.
A Simple Process for Marking Support & Resistance
Practical Example: EUR/USD Resistance
Imagine EUR/USD rallies into the 1.1000 area three separate times.
The 1.1000 region is clearly attracting sellers.
Does that mean you immediately sell?
No. You still evaluate structure, confirmation, stop location and risk-to-reward.
The Complete Support & Resistance Context
A strong trade idea usually combines several pieces of information.
The support zone is one part of the story — not the whole story.
Common Support & Resistance Mistakes
Price often reacts within an area rather than at one exact number.
Reaching support or resistance is not automatically an entry signal.
Support in a strong downtrend behaves differently from support inside a bullish trend.
Too many zones create confusion and remove meaningful context.
Wicks and temporary breaks can trap breakout traders.
Major higher-timeframe zones often carry greater significance.
Support & Resistance Analysis Framework
Stop Drawing Random Lines. Learn Which Levels Actually Matter.
Financial Markets Academy offers live 1-on-1 mentorship for traders who want help identifying meaningful support and resistance, combining those levels with market structure and learning how to wait for proper confirmation before entering.
Reserve Your Seat →Support & Resistance Checklist
Frequently Asked Questions
What is support in trading?
Support is an area where buying pressure previously became strong enough to stop or slow a decline.
What is resistance in trading?
Resistance is an area where selling pressure previously became strong enough to stop or slow an advance.
Should support and resistance be drawn as lines or zones?
Zones are often more realistic because price does not always react at one exact number.
Can resistance become support?
Yes. After resistance is broken, a later pullback can sometimes cause the old resistance area to act as support.
What is a false breakout?
A false breakout occurs when price briefly trades through a support or resistance level but fails to continue and returns back inside the previous area.
Should I enter every time price reaches support?
No. Support and resistance provide context. Traders should still evaluate structure, confirmation, stop placement and risk-to-reward before entering.
Module 2 · Lesson 2 Knowledge Quiz
B. Any green candle
C. A guaranteed reversal point
D. A profit target
B. An area where sellers previously stopped or slowed an advance
C. Any market high
D. A moving average
B. Because market reactions often occur across an area rather than one exact price
C. Because lines are not allowed
D. Because spreads do not exist
B. Yes
C. Only on gold
D. Only on daily charts
B. No, price can produce false breakouts
C. Only on Forex
D. Only with high volume
Key Takeaways
Lesson 3: Break of Structure & Change of Character
You now know how to identify market structure and key reaction zones. Next, we study what happens when those structures begin to fail — and how traders recognize potential continuation or reversal signals.