Module 5 · Trading Sessions, Timing & Market Conditions · Lesson 3
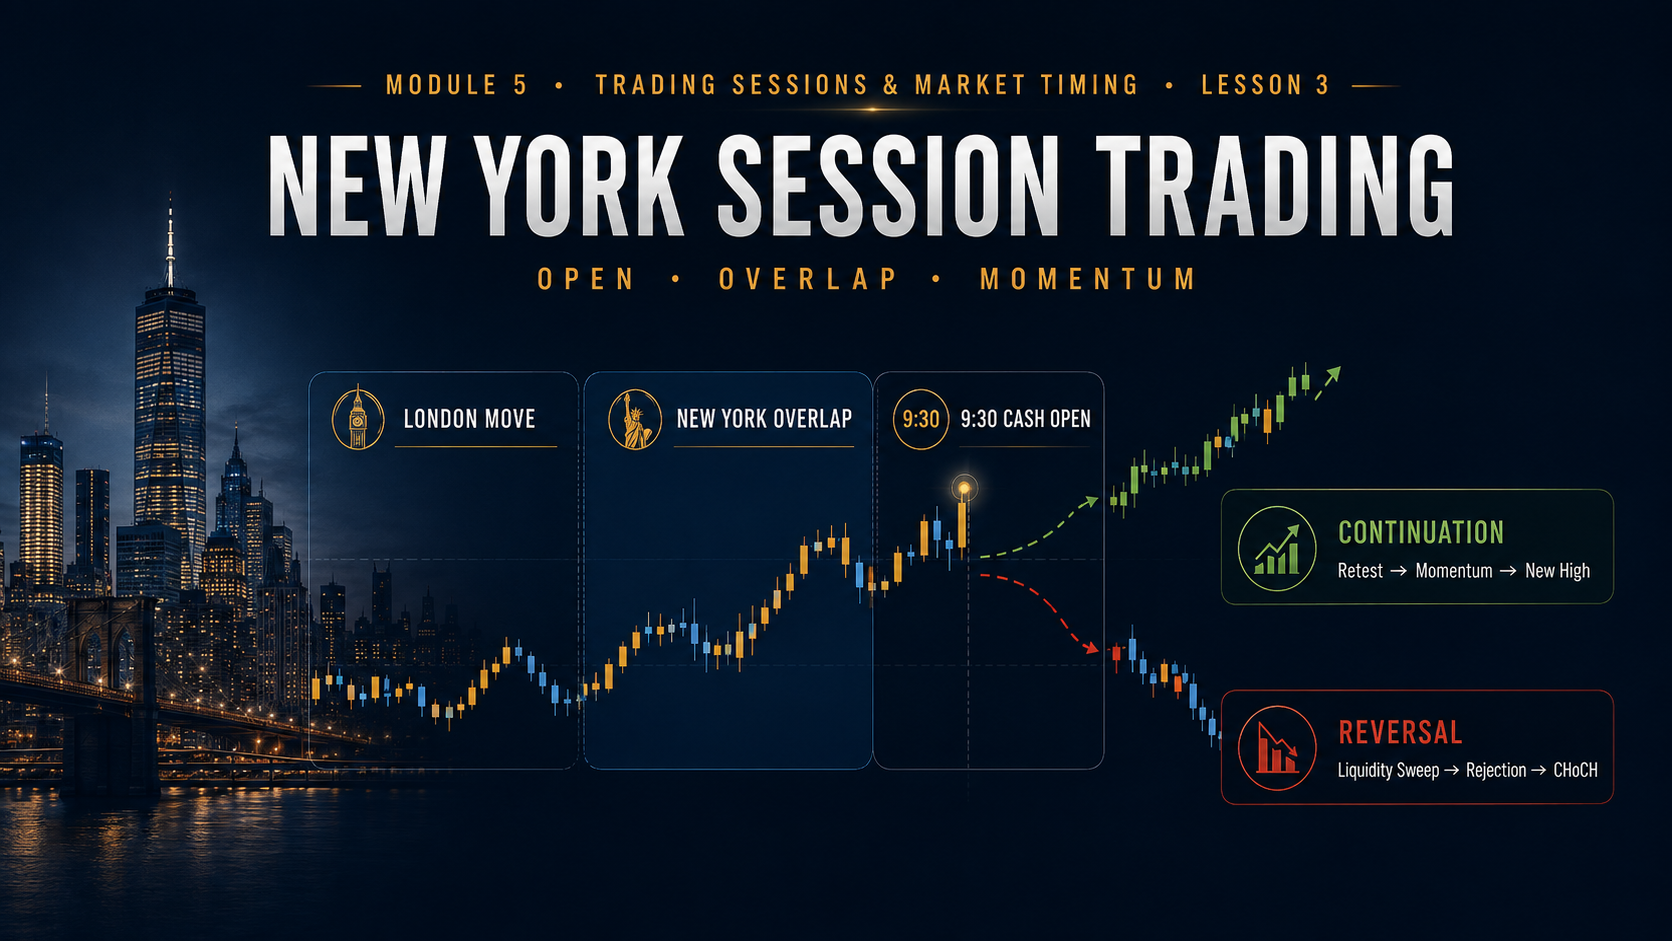
New York Session Trading: Open, Overlap & Momentum
Learn how the New York session interacts with London momentum, U.S. economic releases and the cash-market open — and how to recognize continuation, reversal and high-quality intraday setups.
New York Open
London Overlap
U.S. Data
Momentum
New York is where the trading day often gets its second major burst of energy.
London may already have created a trend, broken a major level or swept liquidity before New York even begins.
Then U.S. economic releases, North American order flow and the U.S. equity-market open can either reinforce that move or completely change it.
New York is not a fresh chart. It inherits everything London already did — and then adds a new wave of participation.
The key is understanding whether New York is continuing the existing move, retracing it, or reversing it.
Lesson Objectives
What You’ll Learn
✓ Why the London–New York overlap matters
✓ How U.S. data changes volatility
✓ Why the U.S. cash open matters
✓ How New York continues London moves
✓ How New York reversals develop
✓ When New York momentum is low quality
Why the New York Session Matters
New York brings a major concentration of U.S. institutional participation, economic data and cross-market activity.
The early part of the session is especially important because London remains open, creating a period where both major financial regions are active together.
New York Session Effect
London Structure + U.S. Liquidity + Economic Data = New Opportunity
The London–New York Overlap
The overlap is one of the most active windows in the trading day because European and North American participants are operating at the same time.
• More market participation
• Higher liquidity
• Larger intraday ranges
• Faster reactions to economic data
• Stronger momentum potential
More activity creates more opportunity, but it also creates faster mistakes if you trade without a plan.
First Question: What Did London Already Do?
Before looking for a New York trade, study the London session.
Did London Trend? Strong directional move already developed.
Did London Range? Price remains compressed.
Did London Sweep Liquidity? Important high or low was attacked.
Did London Reach a Major Level? New York may react there.
New York context begins with London structure.
New York Continuation Setups
A continuation setup occurs when New York reinforces a move that London already established.
London breaks resistance.
Bullish structure forms.
New York pulls back toward broken resistance.
The level holds as support.
New York confirms continuation higher.
Continuation Sequence
London Breakout → New York Pullback → Retest → Confirmation → Continuation
What Strengthens a New York Continuation?
✓ Strong higher-timeframe direction
✓ Clean London displacement
✓ Broken level holds on retest
✓ New York confirmation candle
✓ Structure remains intact
✓ Clear target space remains
New York Reversal Setups
New York can also reverse a London move, especially when London has become extended into a major structural area.
London rallies strongly.
Price reaches higher-timeframe resistance.
New York sweeps the London high.
Bearish rejection develops.
Minor bullish structure fails.
Potential New York reversal.
Reversal Sequence
London Extension → Liquidity Sweep → Rejection → CHoCH → Retest → Reversal
Do Not Reverse London Just Because It Moved a Lot
One of the biggest mistakes is assuming every strong London move is “overextended.”
Strong momentum can continue much farther than expected. A reversal needs evidence, not just a feeling that price has moved too far.
U.S. Economic Releases Can Redefine the Session
Important U.S. data can create some of the fastest intraday price movements of the day.
• Employment data
• Inflation releases
• Retail sales
• GDP-related data
• Central-bank decisions and speeches
• Other high-impact macroeconomic releases
A technically perfect setup seconds before a major U.S. release can become a completely different trade once the data hits.
Compression Before U.S. Data
Markets may become unusually quiet before an important release.
Candles shrink.
Range becomes tight.
Breakouts repeatedly fail.
Market may be waiting for new information.
This is another reason to know the economic calendar before trading a technical breakout.
The First News Spike Can Be Misleading
Immediately after major data, price can move violently in both directions.
Price spikes 40 pips higher.
Breakout traders chase.
Price reverses 60 pips lower.
Initial reaction did not become sustained direction.
Speed is not the same thing as confirmation.
The U.S. Equity Cash-Market Open
The U.S. stock market cash session opens at 9:30 a.m. New York time.
This is particularly important for equity indices such as the S&P 500, Nasdaq and Dow because participation and volatility can increase sharply around the open.
Before Open: Futures already trading.
9:30 New York: Cash equities open.
Potential Effect: New order flow, volatility and directional expansion.
The First Minutes After the Cash Open Can Be Chaotic
The opening burst can create large candles, rapid reversals and false breaks.
A strategy can deliberately wait for the initial opening volatility to settle before demanding confirmation.
The Opening Range
Some intraday traders monitor the high and low created during the early portion of the New York cash session.
Opening Range High: Early session upper boundary.
Opening Range Low: Early session lower boundary.
Later Use: Breakout, sweep, retest or liquidity reference.
Example: New York Index Continuation
Bullish Example
Premarket: Index is bullish.
Cash Open: Initial pullback occurs.
Support: Pullback holds above prior breakout.
Confirmation: Bullish candle closes above previous short-term high.
Result: Momentum resumes.
Example: New York Opening Reversal
Premarket rallies into major resistance.
Cash open spikes above premarket high.
Price rejects sharply.
Minor bullish structure breaks.
Opening breakout becomes a liquidity sweep and reversal.
London High and Low Become New York Reference Points
By the time New York becomes active, London has often created visible intraday extremes.
London High
London Low
Asian High
Asian Low
Previous Day High
Previous Day Low
New York may break, sweep, reject or target these levels.
New York Sweep of the London High
Potential Bearish Sequence
London High → New York Sweep → Rejection → Bearish CHoCH → Retest
New York Sweep of the London Low
London low is attacked.
Sell-side liquidity is taken.
Price reclaims the level.
Bullish confirmation develops.
Potential New York reversal higher.
New York Midday Can Behave Differently
After the most active early-session window, markets can become slower and more rotational.
The same breakout strategy that works well during the open may perform differently during midday.
Smaller candle ranges
More overlap
Less urgency
Potential consolidation before later movement
Late New York
Late-session conditions can vary significantly by instrument.
Some markets lose momentum as European participation disappears, while U.S. equities may remain active into their own close.
Your trading plan should define whether late-session entries are allowed instead of assuming every hour of New York offers the same opportunity.
What Makes a High-Quality New York Setup?
✓ Clear higher-timeframe structure
✓ Clear understanding of London move
✓ Important New York reference level
✓ No unexpected high-impact release seconds away
Free Academy Access
Unlock the rest of this lesson free
Sign in to continue, or create a 100% free Academy account and unlock the full member experience.
ALREADY A MEMBER?
Sign In & Continue
Access the rest of this lesson instantly.
Forgot password?

 11 min
 11 min
 12 min