
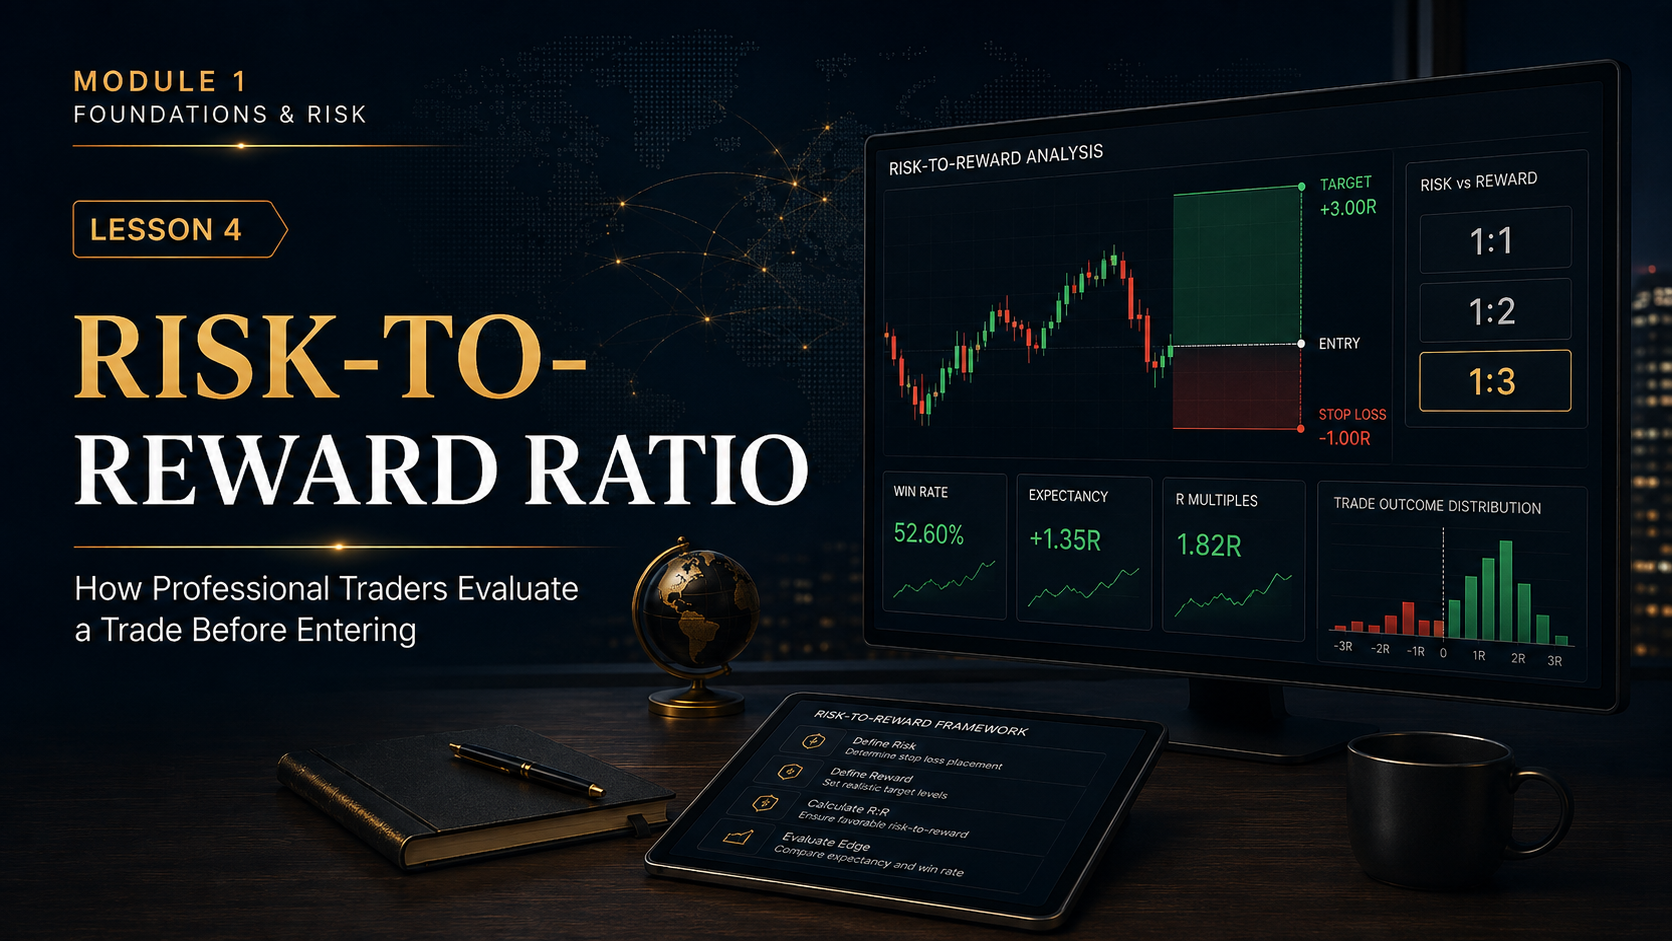
Risk-to-Reward Ratio: How Professional Traders Evaluate a Trade Before Entering
Learn how to compare potential loss with potential profit, calculate risk-to-reward ratios, avoid weak setups and judge whether a trade is worth taking before you ever enter.
A trade can look attractive and still be a terrible trade.
Maybe the direction makes sense. Maybe the entry looks clean. Maybe price is sitting at a strong technical level.
But if you have to risk $500 for the realistic possibility of making $100, the setup may not deserve your capital.
That is where the risk-to-reward ratio becomes one of the most useful tools in trade planning.
What You’ll Learn
What Is Risk-to-Reward Ratio?
Risk-to-reward ratio compares how much you are prepared to lose on a trade with how much you could potentially make if the trade reaches its target.
It is usually written like this:
Risk 1 unit to potentially make 2 units.
The “unit” can be dollars, pips, points, percentages or another consistent measurement.
Simple Risk-to-Reward Examples
How to Calculate Risk-to-Reward
You need three basic pieces of information:
Entry to stop:
Entry to target:
Pips vs. Dollars: The Ratio Stays the Same
Suppose your position size means each pip is worth $5.
| Measurement | Risk | Reward | Ratio |
|---|---|---|---|
| Pips | 20 | 40 | 1:2 |
| Dollars | $100 | $200 | 1:2 |
The unit changes. The relationship does not.
Why Risk-to-Reward Matters
Risk-to-reward helps traders evaluate the quality of the opportunity before money is committed.
It answers an important question:
This does not guarantee that the trade will win. It simply helps ensure that the potential payoff makes sense relative to what you are putting at risk.
Win Rate Is Only Half the Story
Beginners often obsess over win rate.
They want a strategy that wins 80%, 90% or even 100% of the time.
But win rate without risk-to-reward tells you very little.
Trader A wins much more frequently, but one loss can erase several wins. Trader B wins less often, but each winner can cover multiple losses.
The Bigger Concept: Trading Expectancy
Risk-to-reward and win rate work together to create what traders often call expectancy.
Expectancy asks whether a strategy is likely to make or lose money over a large sample of trades.
Example Strategy
Over 10 trades:
Breakeven Win Rate
Every risk-to-reward structure has an approximate win rate required to break even before costs.
| Risk-to-Reward | Approx. Breakeven Win Rate |
|---|---|
| 1 : 0.5 | About 66.7% |
| 1 : 1 | 50% |
| 1 : 2 | About 33.3% |
| 1 : 3 | 25% |
In real trading, spreads, commissions, slippage and execution reduce results, so practical breakeven rates may be slightly higher.
Does Every Trade Need a 1:2 Risk-to-Reward Ratio?
No.
One of the most common mistakes in trading education is turning 1:2 into a rigid rule regardless of market structure.
A trade should not have an unrealistic target simply because you want the calculator to display 1:2.
What if major resistance is only 25 pips above your entry?
The chart does not care about your preferred ratio.
Let Market Structure Define the Opportunity
Your stop and target should be based on meaningful market levels.
A Good Setup Can Still Have Poor Risk-to-Reward
Suppose you identify a strong bullish setup.
The market structure looks good. Buyers are in control. Your confirmation appears.
But you entered late.
The original market idea may have been excellent. Your late entry turned it into a poor opportunity.
Entry Quality Changes Risk-to-Reward
Two traders can trade the same market direction and get very different results simply because of entry location.
Patient Entry
Chases Price
Same market. Same overall direction. Completely different trade quality.
Higher Risk-to-Reward Is Not Automatically Better
A 1:5 trade sounds better than a 1:2 trade.
But only if the target is realistic.
A trader who constantly targets huge moves may achieve impressive theoretical ratios while rarely reaching the target.
What About Partial Profits?
Some traders do not close the entire position at one target.
They may take partial profit at one level and leave the remainder open for a larger move.
Example
Once you begin scaling out, the final realized risk-to-reward calculation becomes more complex than a simple one-target trade.
Understanding “R” Multiples
Traders often describe performance using R.
One R represents the amount initially risked.
Using R makes it easier to compare performance across different account sizes and position sizes.
Example: Tracking Trades in R
| Trade | Result | R Result |
|---|---|---|
| Trade 1 | Loss | -1R |
| Trade 2 | Win | +2R |
| Trade 3 | Loss | -1R |
| Trade 4 | Win | +3R |
| Total | 2 Wins / 2 Losses | +3R |
The trader only won 50% of the trades and still finished significantly positive.
Risk-to-Reward Must Be Combined With Probability
A ratio by itself does not tell you whether a trade is good.
You also need to consider the probability of reaching the target.
The higher number does not automatically make Trade B superior.
When Should You Skip a Trade?
Sometimes the best decision is not to trade.
Possible Reasons to Pass
Complete Trade Planning Example
Imagine a trader is evaluating a EUR/USD buy setup.
The trader now understands the complete trade before entering — direction, invalidation, target, financial risk and potential reward.
Common Risk-to-Reward Mistakes
The market structure should determine the target, not an arbitrary ratio.
Risk-to-reward and probability must be evaluated together.
A 1:10 target means nothing if price has almost no realistic chance of reaching it.
Poor entry location can destroy an otherwise attractive risk-to-reward profile.
Increasing stop distance changes your original risk and can destroy the planned ratio.
Closing every winner early can dramatically reduce your actual average reward.
The Professional Pre-Trade Framework
Learn to Evaluate the Trade Before You Enter It
Financial Markets Academy offers live 1-on-1 mentorship for traders who want to learn how to identify quality setups, define risk, set realistic targets and build a trading process that is based on structure instead of emotion.
Reserve Your Seat →Risk-to-Reward Checklist
Frequently Asked Questions
What is a good risk-to-reward ratio in trading?
There is no single ratio that is best for every strategy. A good ratio must be realistic for the setup and work together with the strategy’s win rate and overall expectancy.
What does 1:2 risk-to-reward mean?
A 1:2 ratio means you are risking one unit of loss for the possibility of gaining two units. For example, risking $100 to potentially make $200.
Can a trader be profitable with a 40% win rate?
Yes. If average winning trades are sufficiently larger than average losing trades, a strategy can potentially be profitable even with a win rate below 50%.
Is 1:3 better than 1:2?
Not automatically. The higher target must still be realistic. A lower ratio with a stronger probability of success may be superior to an unrealistic high-R setup.
Should I always target two times my stop loss?
No. Targets should reflect market structure, volatility and the strategy being traded rather than an arbitrary fixed multiple.
What is an R multiple?
R represents your initial risk. A full planned loss is -1R, while a winner twice the amount risked is +2R.
Lesson 4 Knowledge Quiz
B. Risk 1 unit to potentially make 2 units
C. Win two trades for every loss
D. Risk 2% per trade
B. No
C. Only Forex trades
D. Only gold trades
B. Market structure and the trading setup
C. Maximum leverage
D. Another trader’s target
B. Yes, if average winners outweigh average losses sufficiently
C. Only on demo
D. Only with no stop loss
B. Three losing trades
C. Risking 3%
D. Three open positions
Key Takeaways
Lesson 5: Building Your First Trading Plan
You now understand market basics, risk management, position sizing and risk-to-reward. The final lesson in Module 1 brings those pieces together into a written trading plan with rules for entries, risk, sessions, losses and execution.